This can only be accessed by an Admin or an authorized user.
The Reports features must be enabled to access the Reports menu. Refer to this article for more information.
Charts follows the rules below when it comes to granularity / intervals displayed.
Selected timeframe / Granularity:
- Below 1 month / Days
- Greater than 1 month to 3 months / Weeks
- Greater than 3 months to 1 year / Months
- Greater than 1 year / Years
Access the Leaderboard Reports
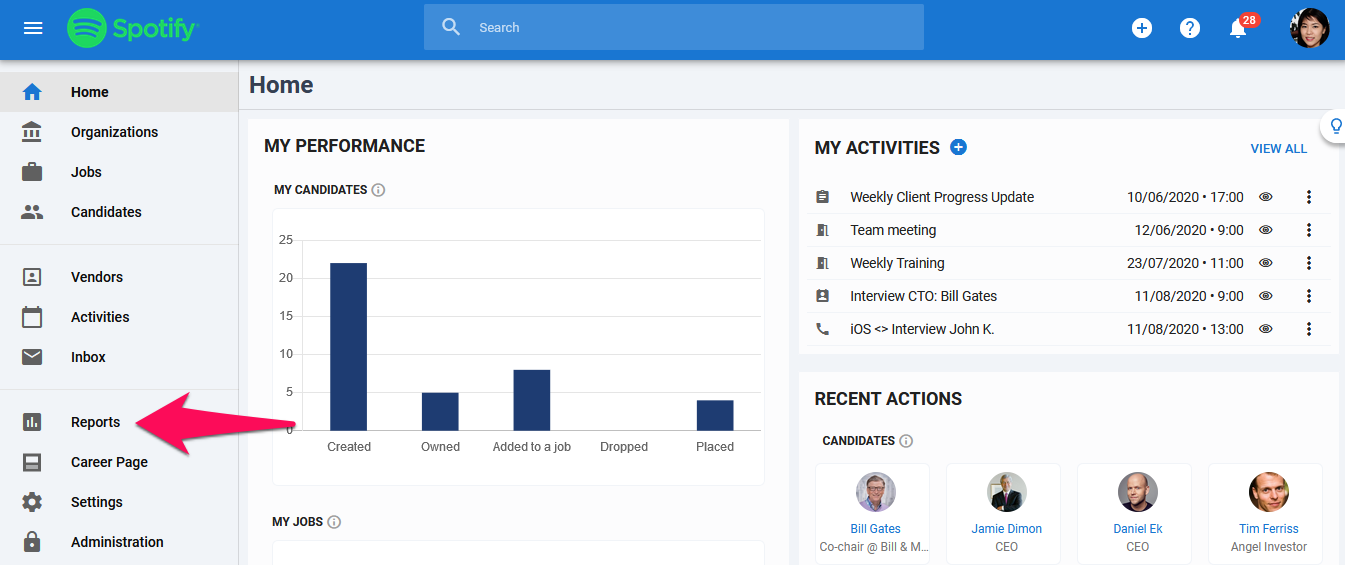
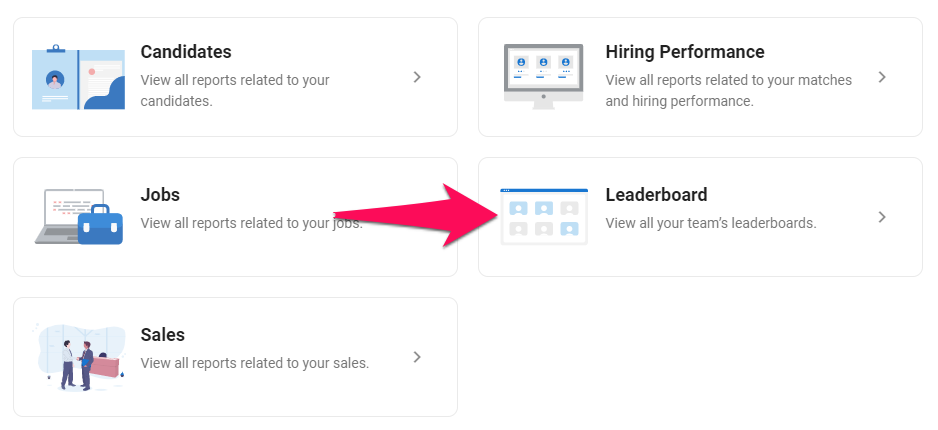
- Head to the following page. Alternatively, click on "Reports" from your side menu then open the "Leaderboard" category.
Candidate Performance
Candidates created by user: Total number of candidates created sorted by user.
Candidates owned by user: Total number of candidates owned sorted by user.
Recruitment Performance
Matches by user: Total number of matches sorted by user.
Placements/Hires by user: Total number of placements/Hires sorted by user.
Dropped candidates by user: Total number of dropped candidates sorted by user.
Activity report by user: Total number of activities created, emails sent, notes and attachments added sorted by user.
Job Performance
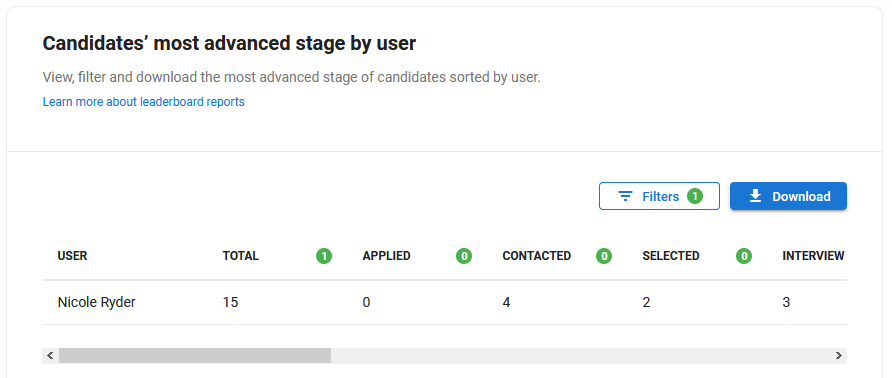
Candidates’ most advanced stage by user: The report shows the total number of jobs owned by each user, and what is the most advanced stage of those jobs. Those stages are based on your customizable pipeline stages. For each job counted in the "Total" column, a value of 1 will be added in the furthest stage in which you have a candidate for that specific job.
Example: In the screenshot below, a value of 4 in the "Contacted" column means that there are 4 jobs owned by user Nicole Ryder for which the most advanced candidates are in the "Contacted" stage.
Job status by user: All jobs' status sorted by user.