Esta guía explica los informes predefinidos disponibles en la biblioteca de Informes Avanzados.
Los valores de muestra son ilustrativos y diferirán de los de su cuenta.
Los datos de los Informes Avanzados se actualizan cada 6 horas.
Agregar un Informe de la Biblioteca
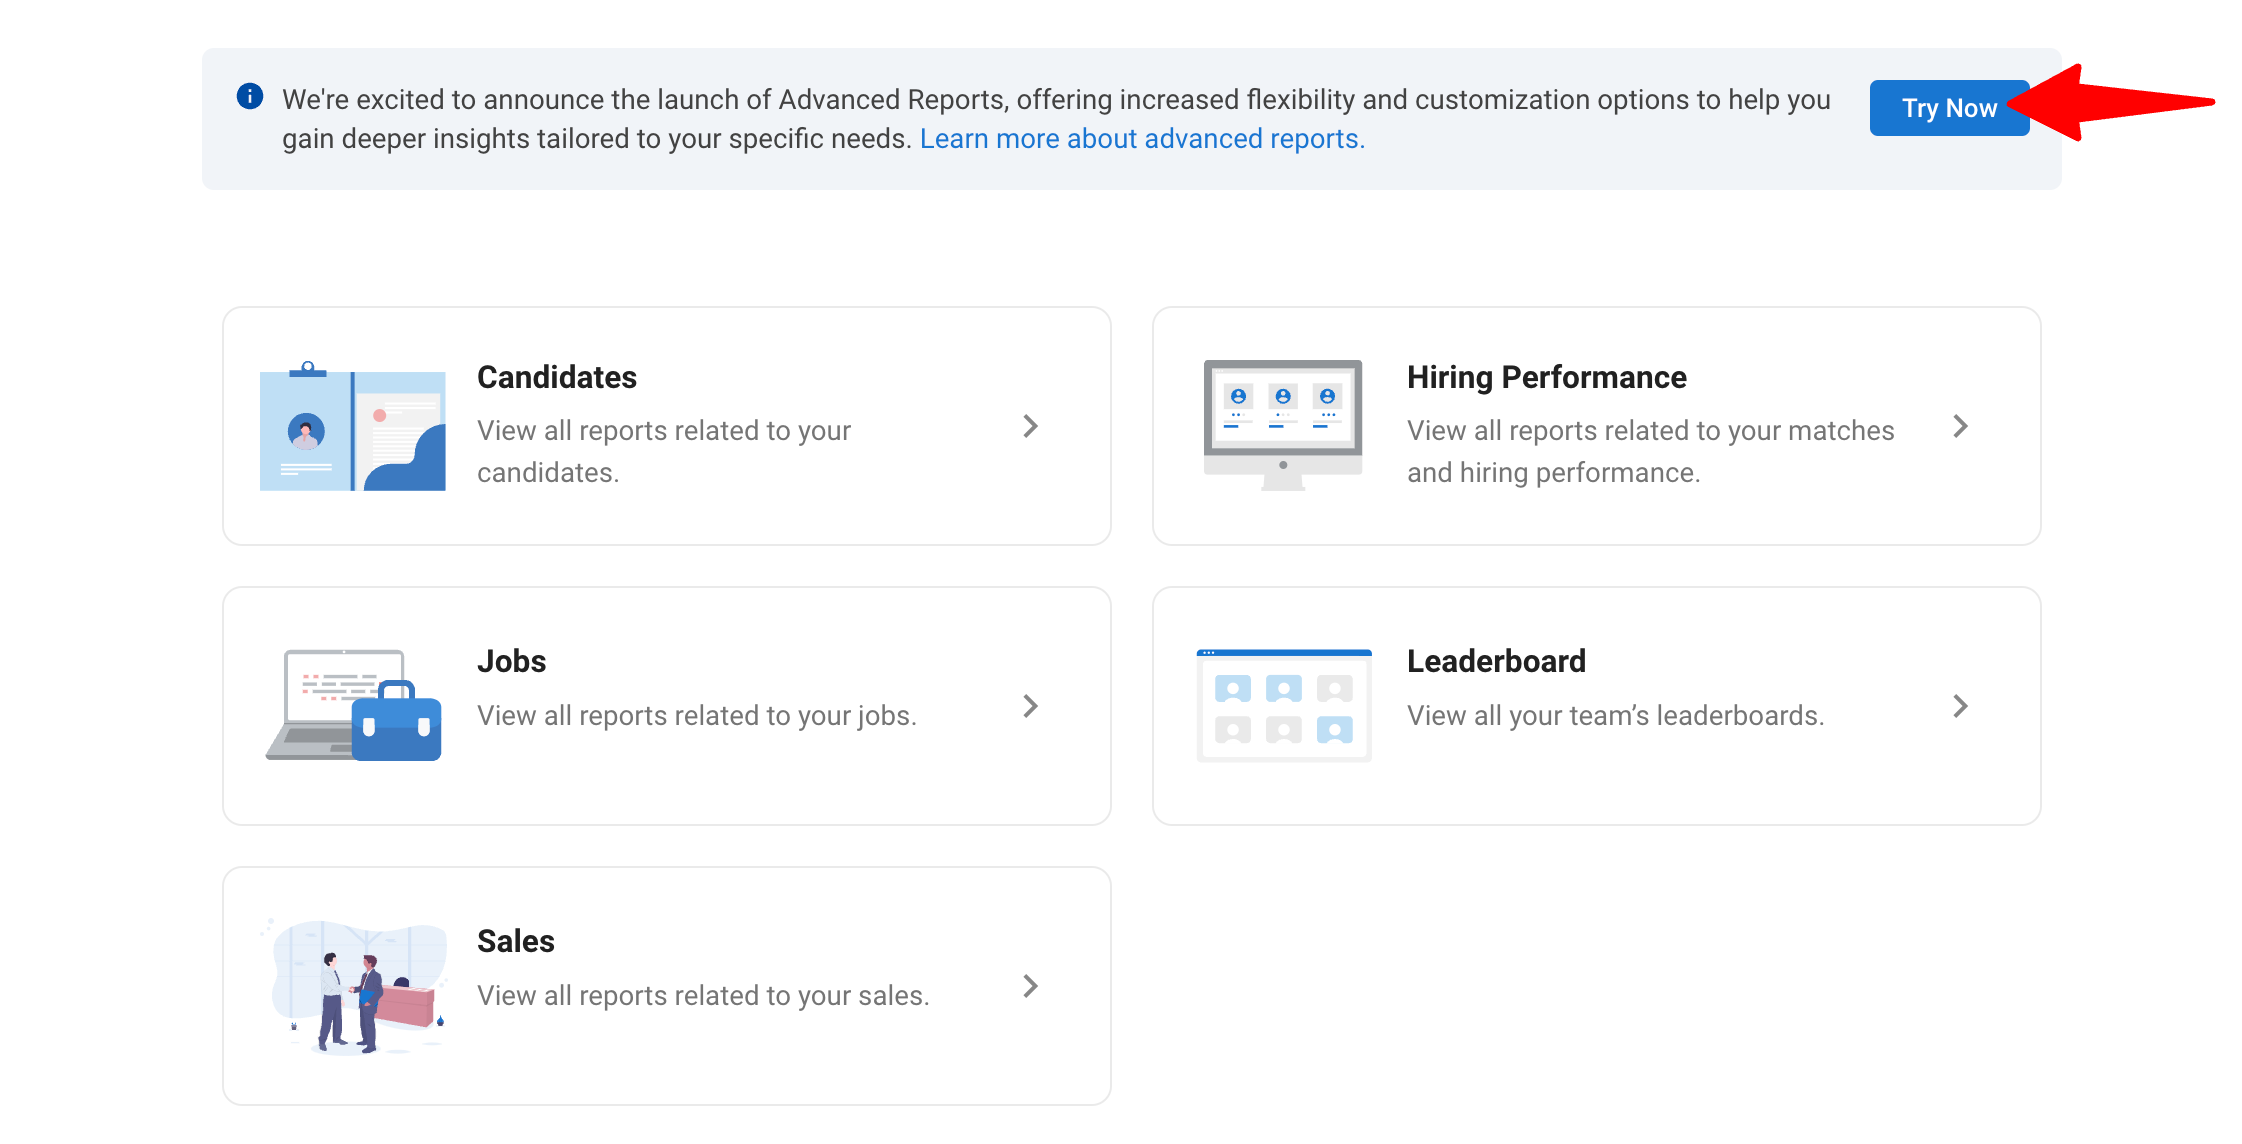
- Diríjase a la siguiente página. Alternativamente, haga clic en "Informes" en su menú lateral y haga clic en el botón "Probar ahora" en el banner en la parte superior de la página.
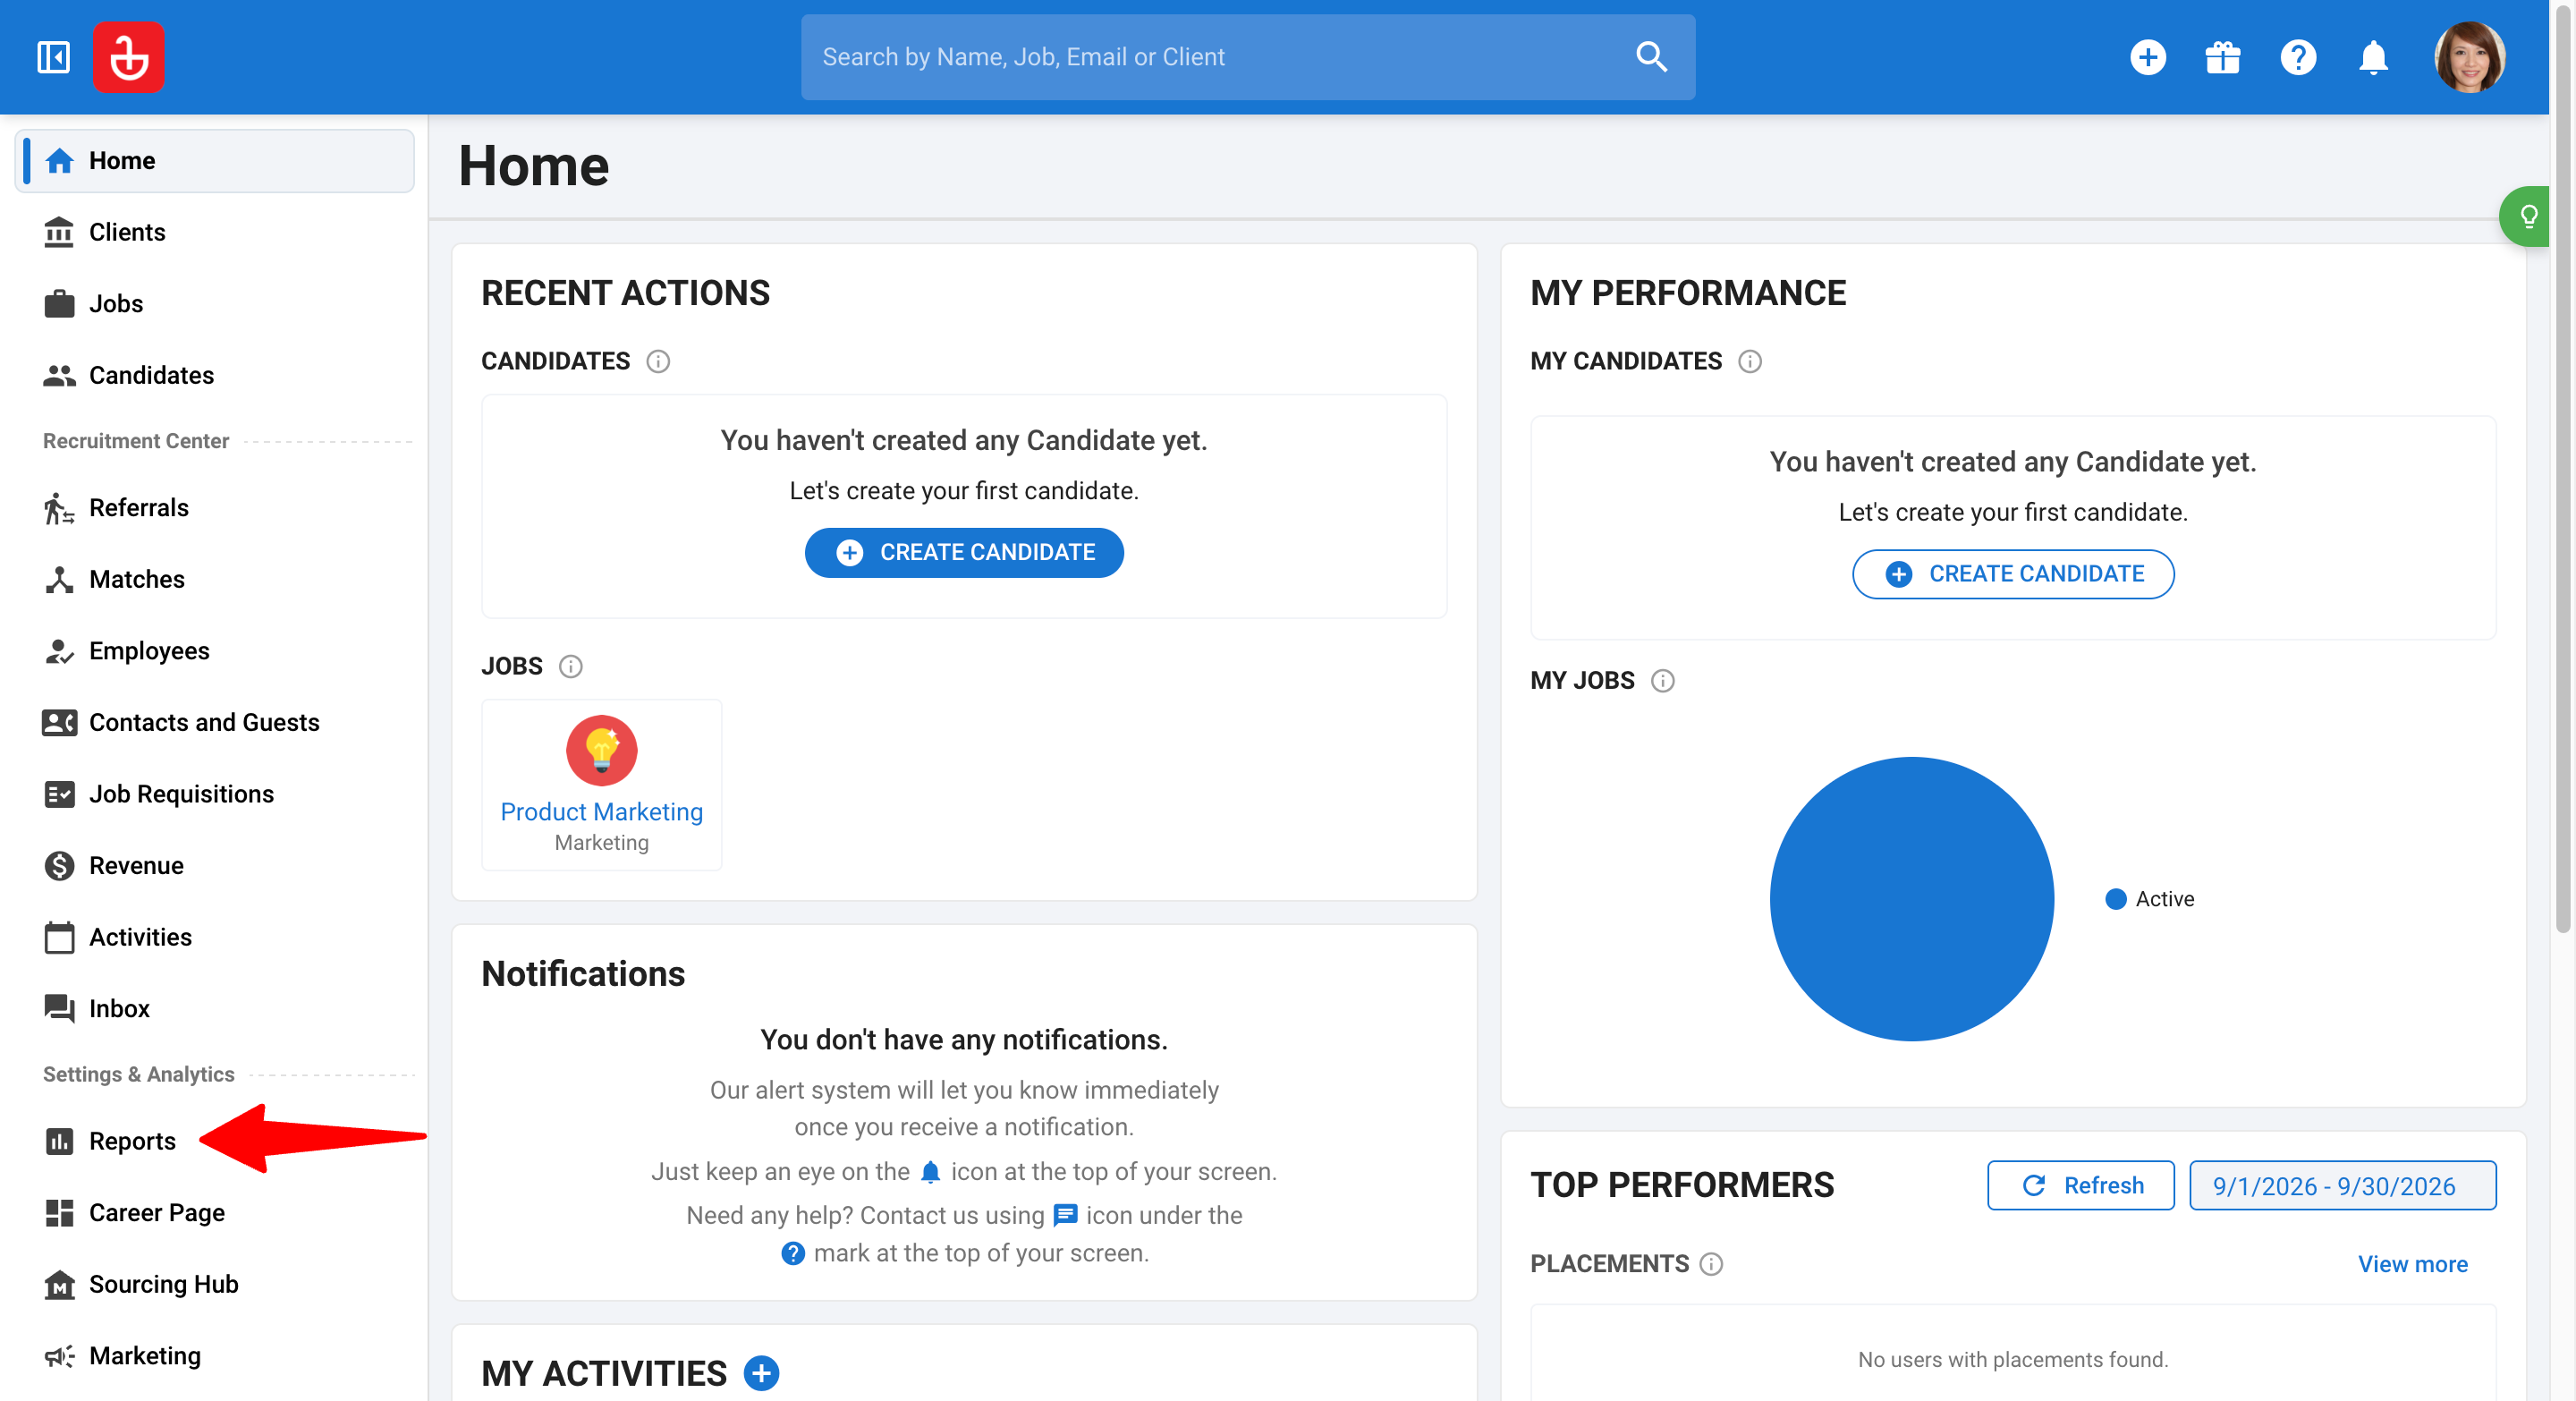
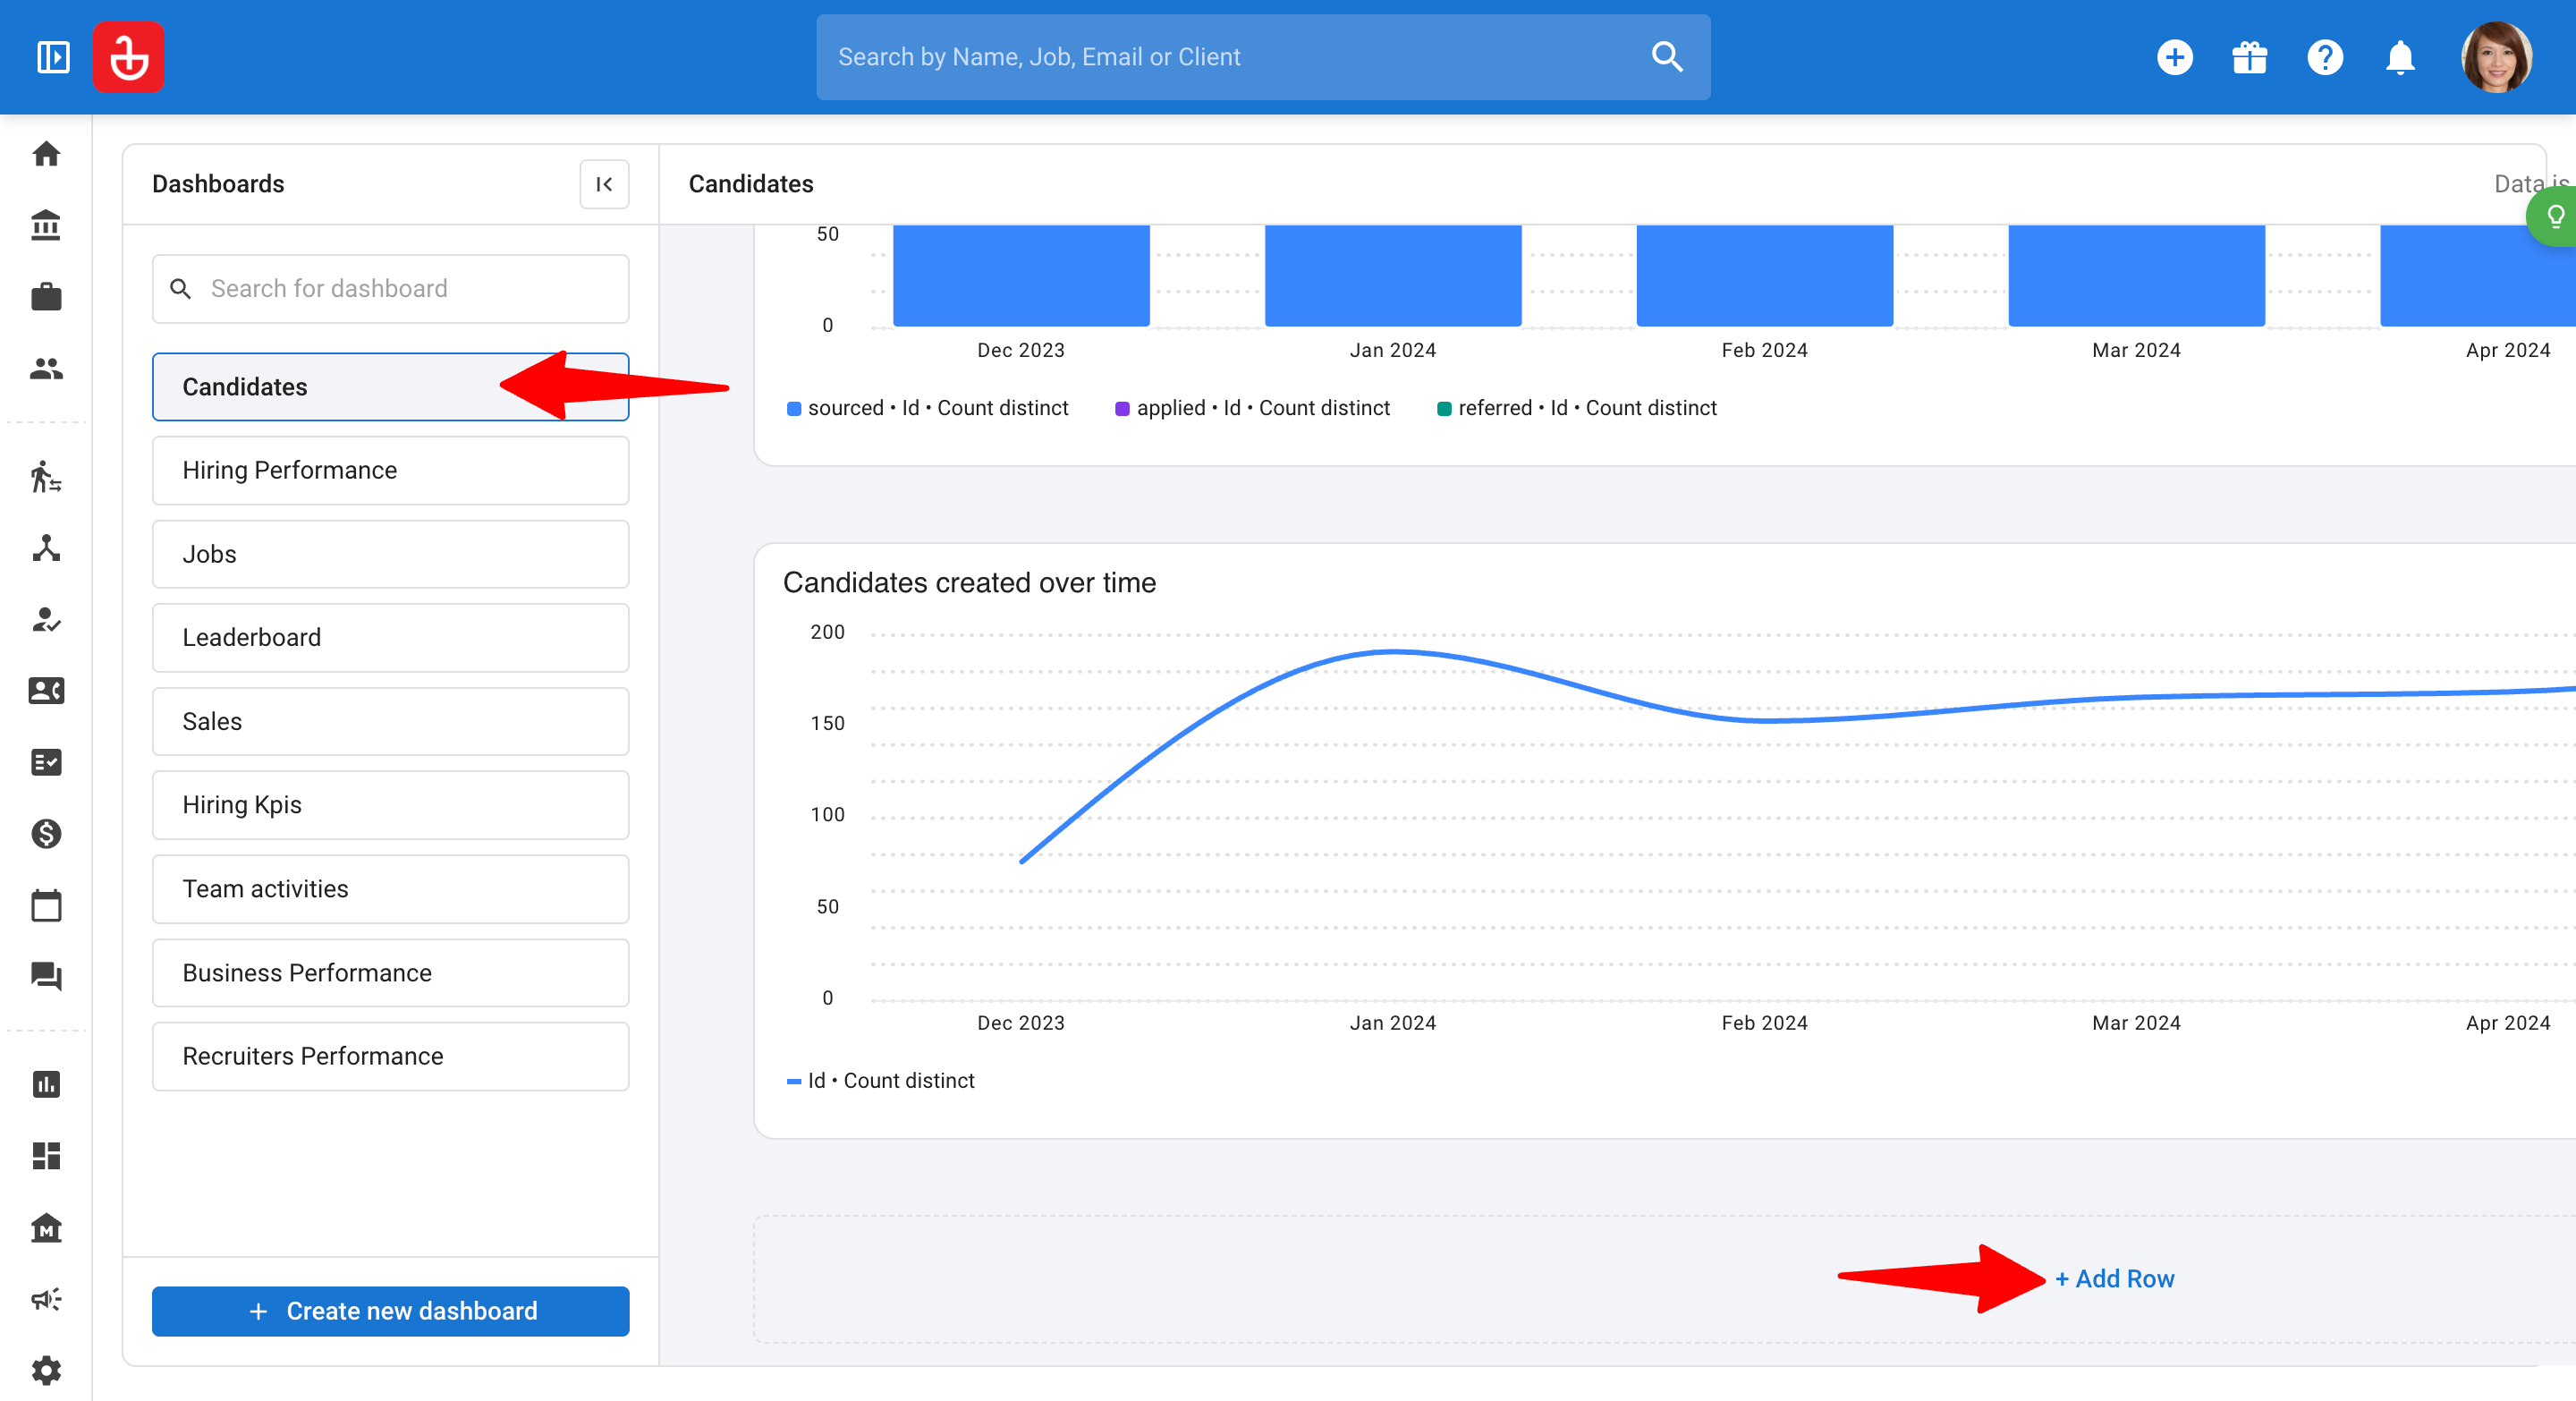
- En la página de Informes Avanzados, seleccione un panel existente y haga clic en "Agregar Fila".
-
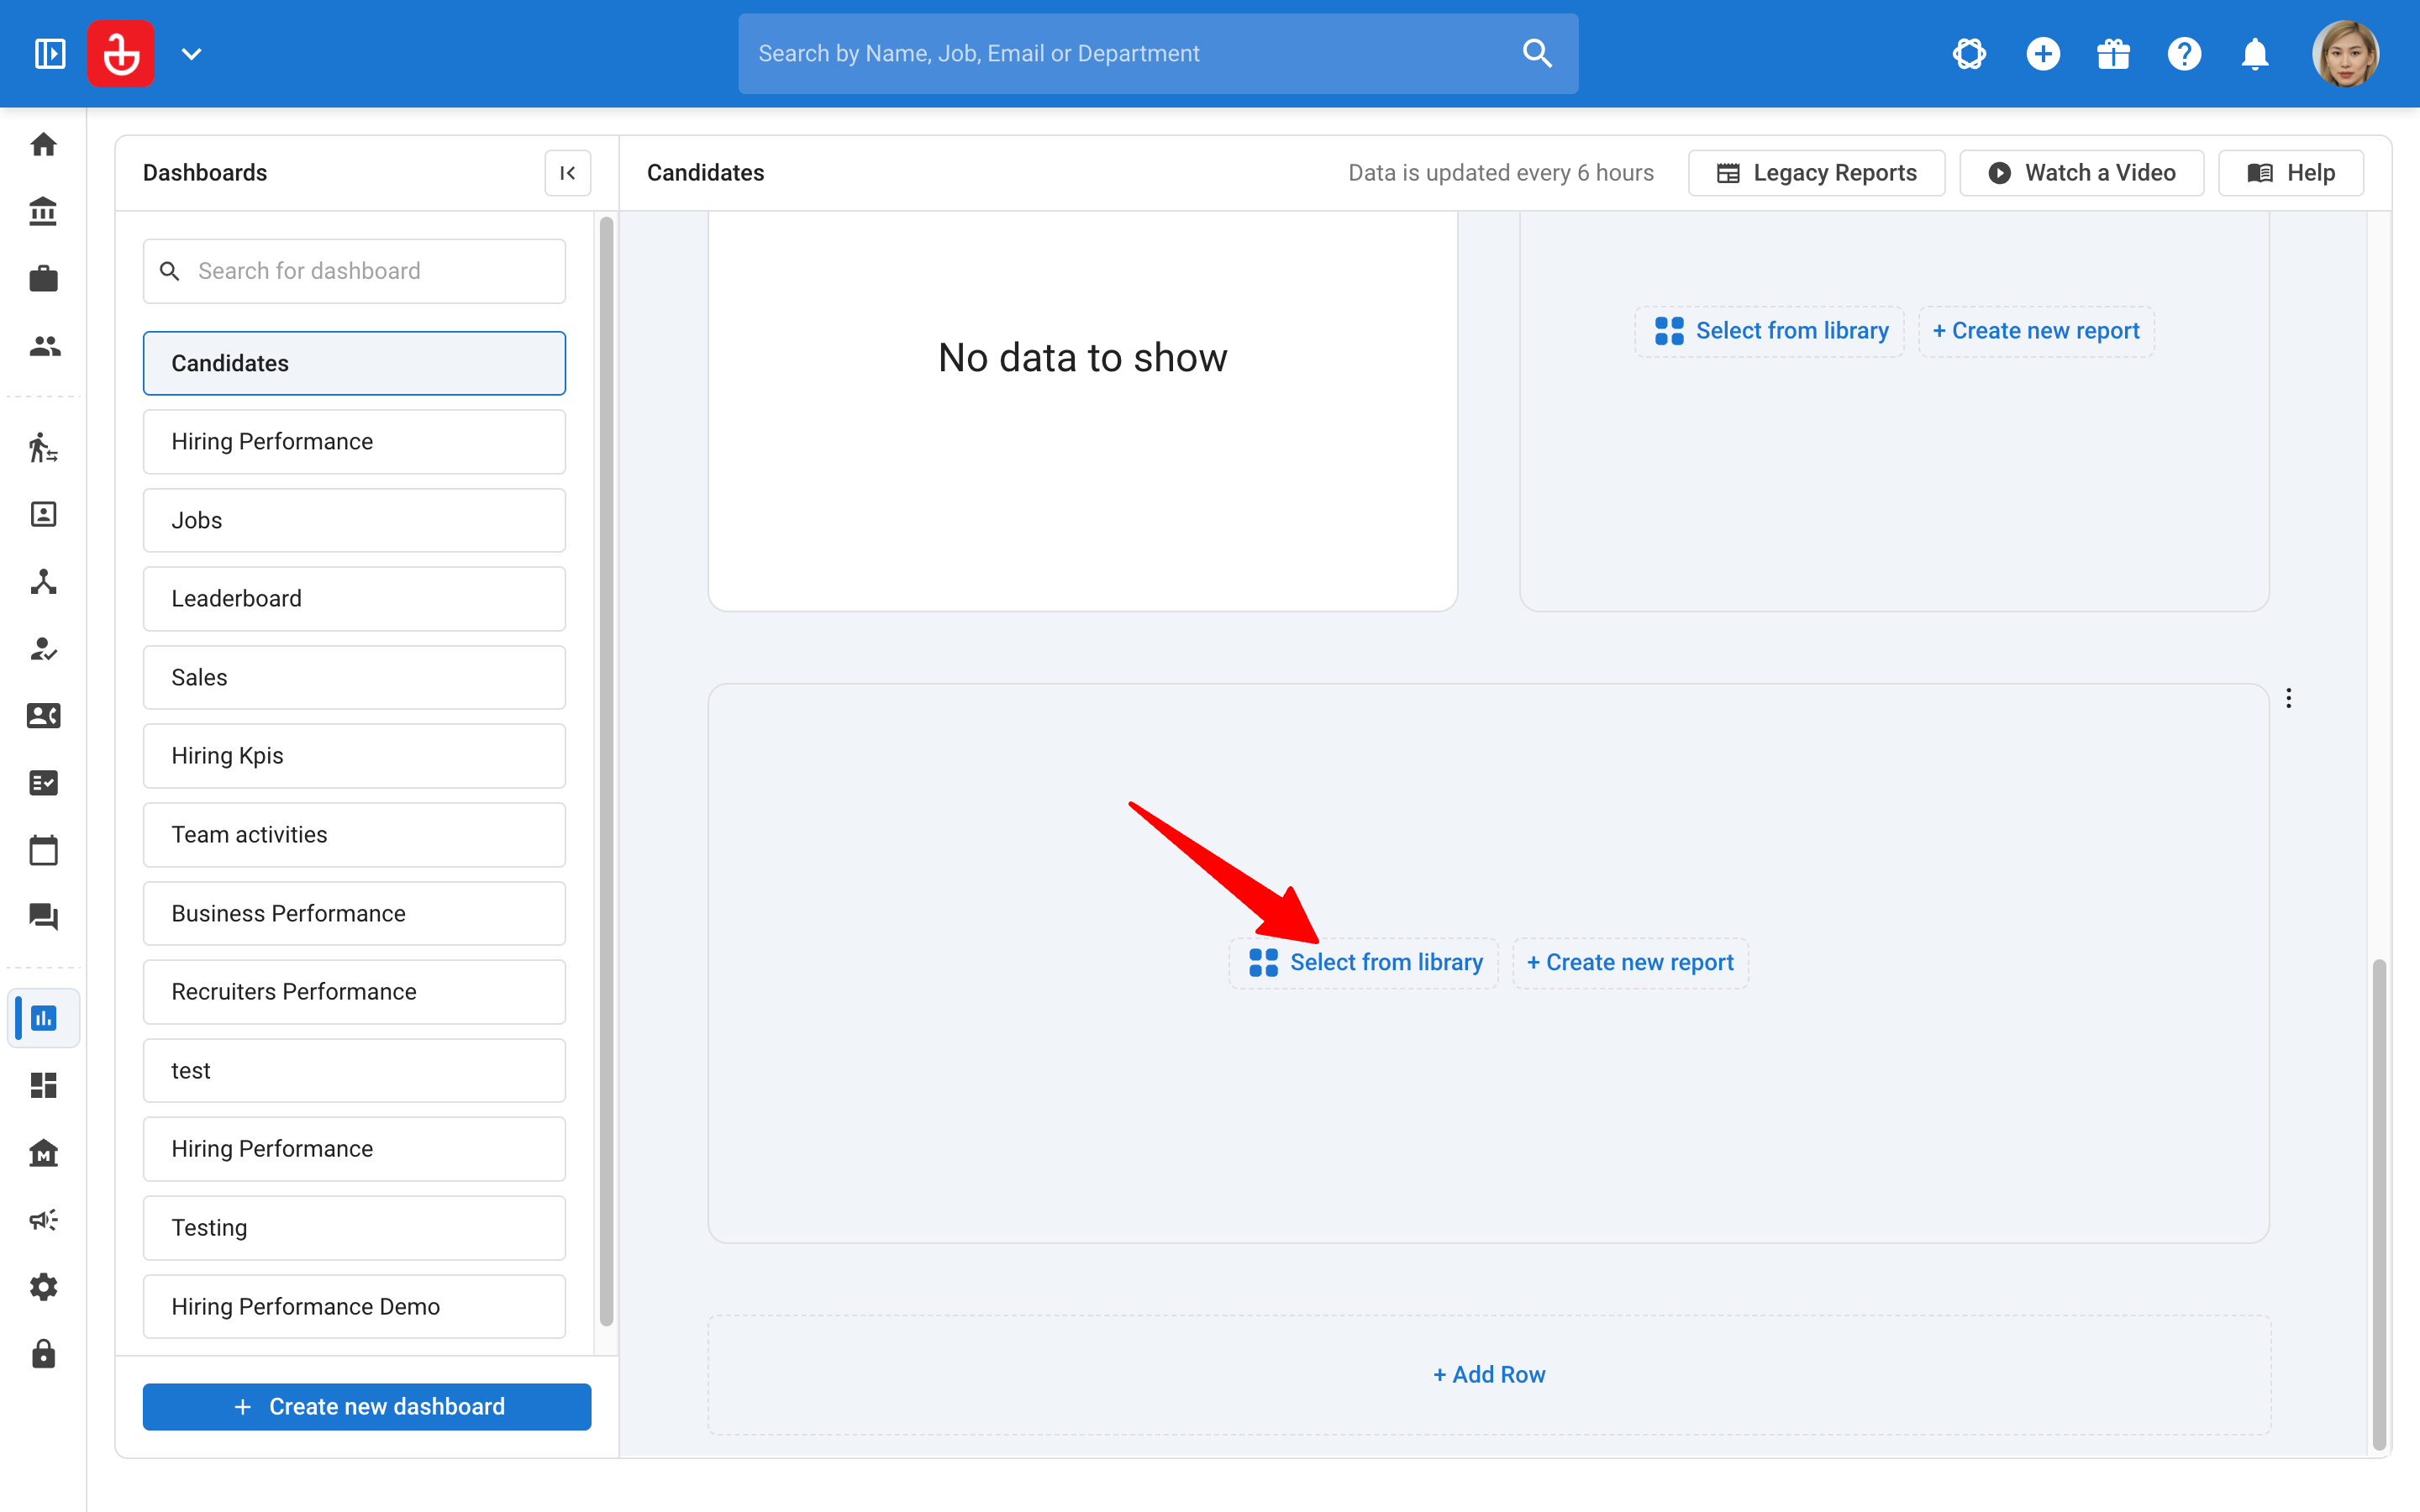
Haga clic en "Seleccionar de la biblioteca".
-
En la biblioteca, busque los informes marcados con una marca de verificación azul. Estos son los Informes Avanzados integrados de Manatal.
Seleccione el informe que desea y haga clic en "Agregar al panel".NotaLos Informes Avanzados integrados se identifican por la marca de verificación azul junto al nombre del informe. También puede agregar informes personalizados a la biblioteca. A diferencia de los informes integrados de Manatal, los informes personalizados no mostrarán una marca de verificación azul. Obtenga más información sobre los informes personalizados en esta guía.
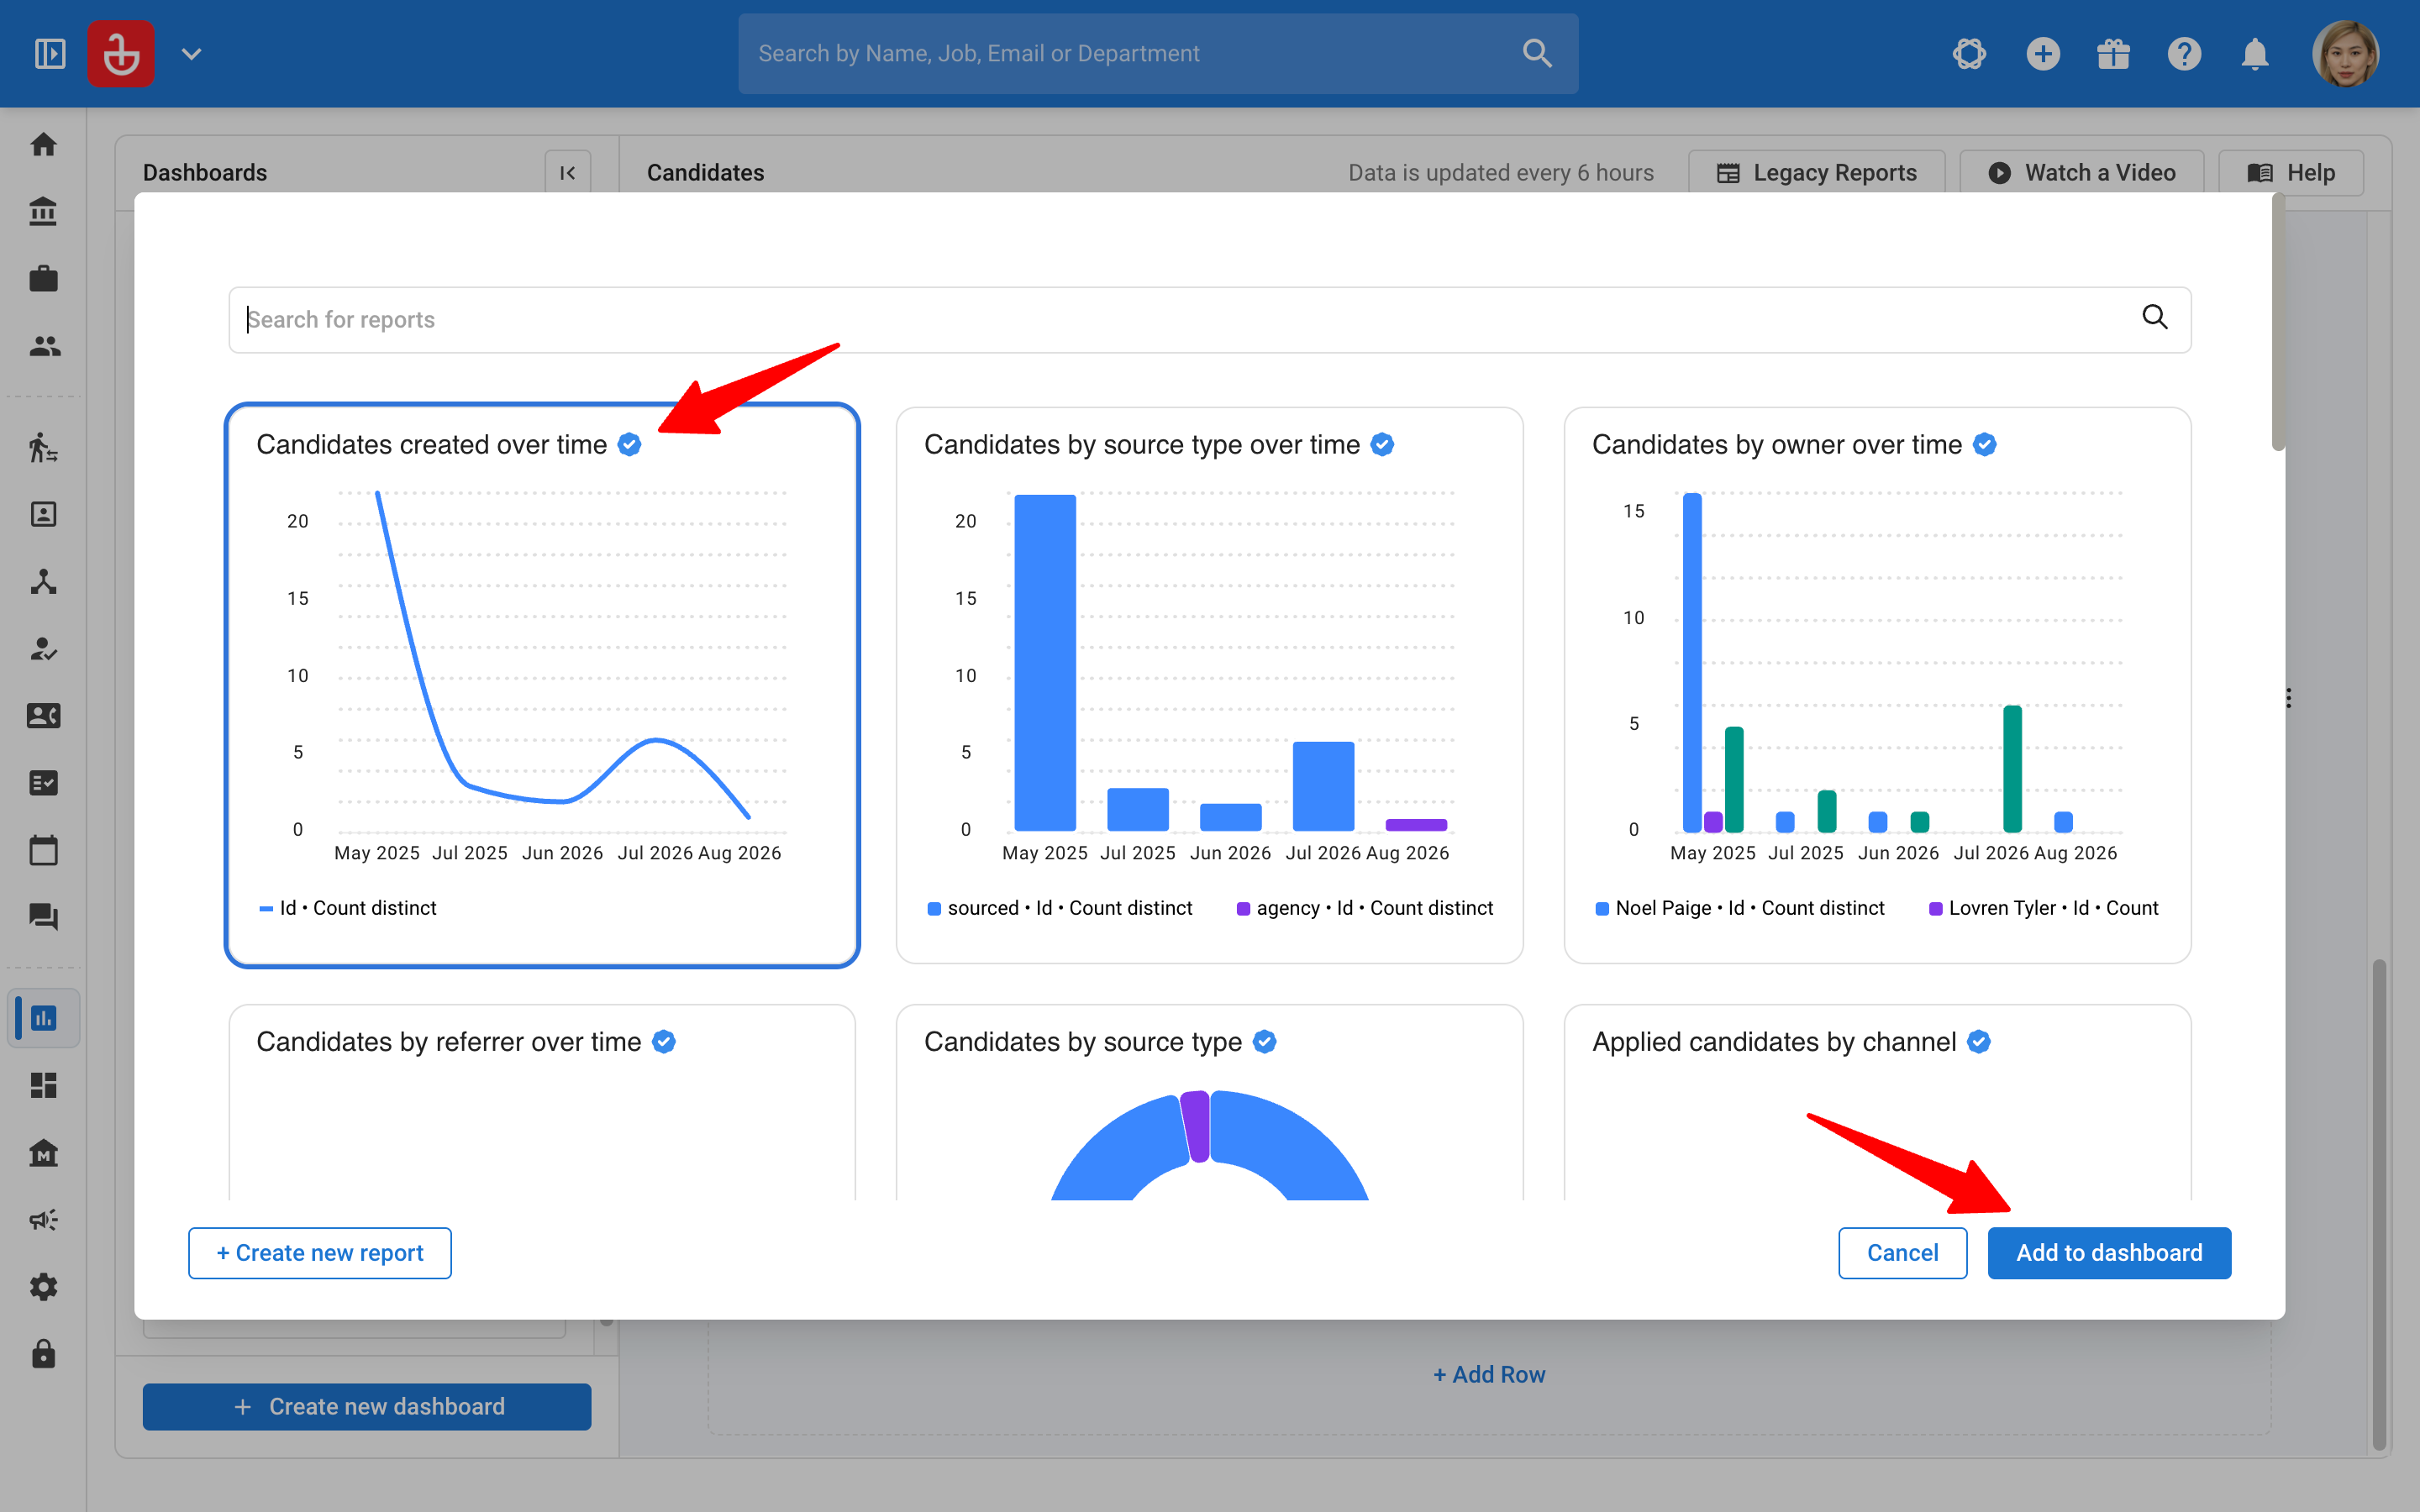
1. Candidatos creados a lo largo del tiempo
-
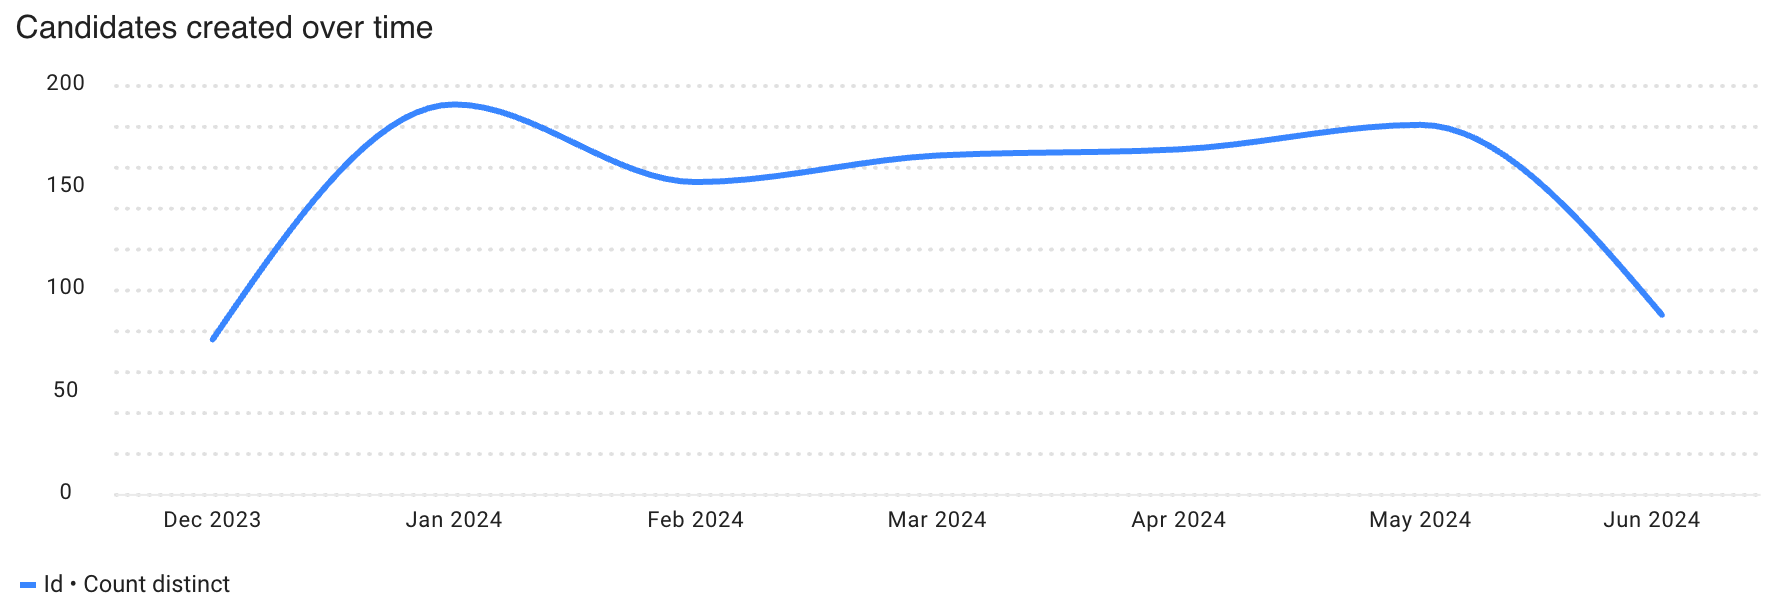
Qué muestra: El número de registros de candidatos creados a lo largo del tiempo.
-
Caso de uso: Realizar un seguimiento del crecimiento en la base de datos de candidatos y detectar aumentos o disminuciones inusuales en la creación de candidatos.
2. Candidatos por tipo de origen a lo largo del tiempo
-
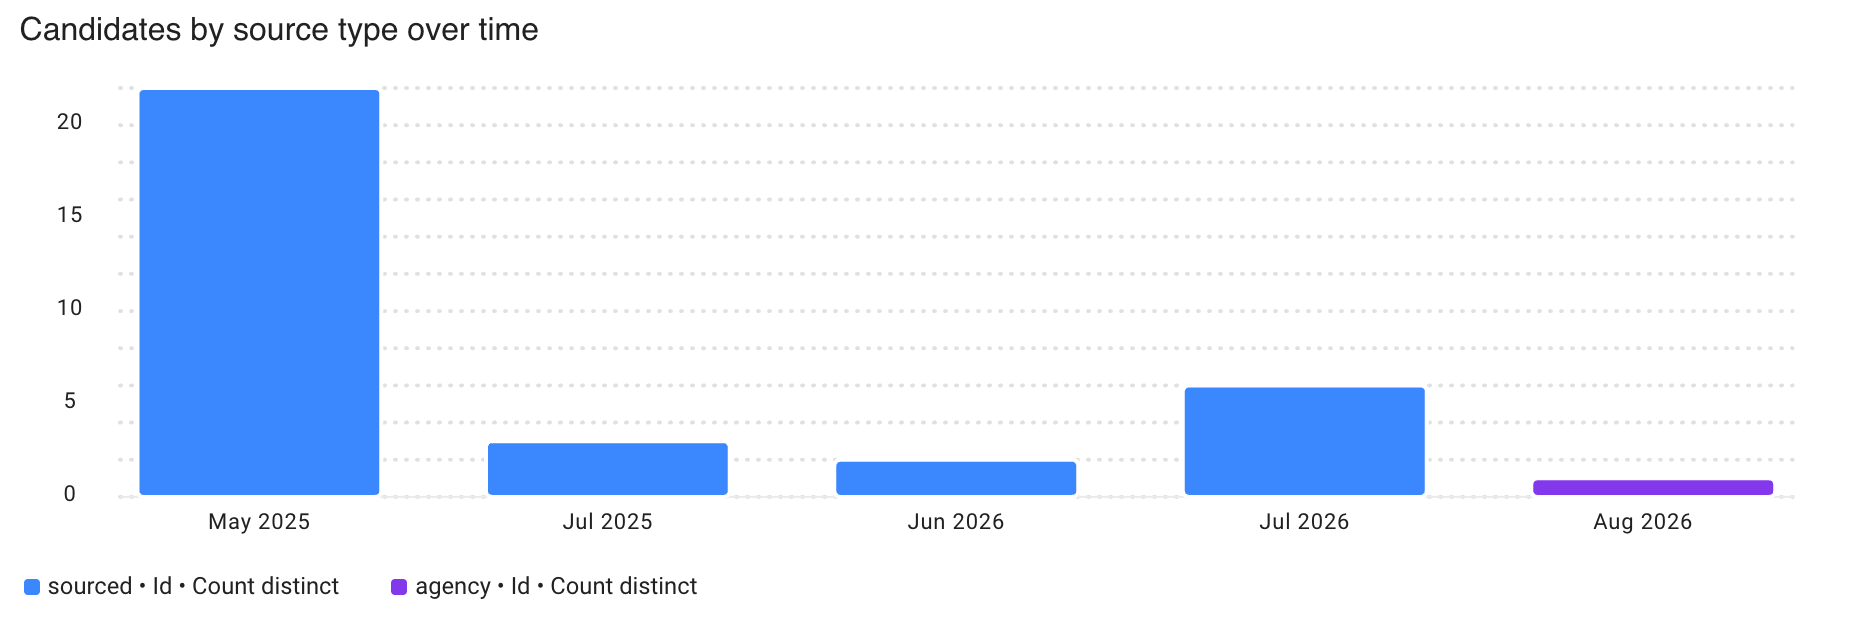
Qué muestra: La creación de candidatos agrupada por tiempo, dividida por tipo de origen, como contactado, postulado, referido o agencia.
-
Utilice este informe para: Comparar cómo cambia la mezcla de tipos de candidatos a lo largo del tiempo e identificar qué tipo contribuye más.
3. Candidatos por propietario a lo largo del tiempo
-
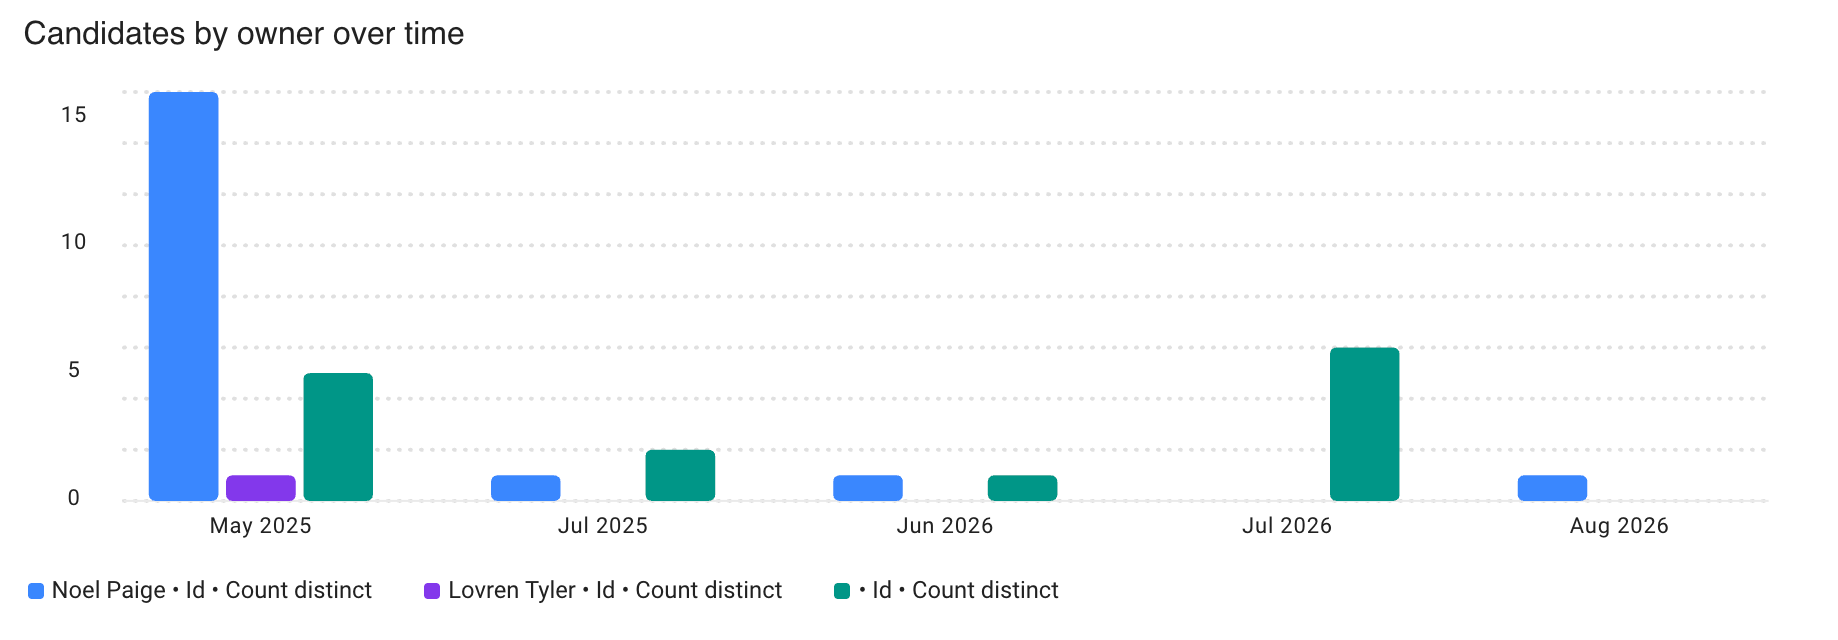
Qué muestra: La creación de candidatos a lo largo del tiempo, dividida por el usuario que es propietario de cada candidato.
-
Utilice este informe para: Revisar la distribución de la propiedad, la carga de trabajo de los reclutadores y los cambios en la contribución a la base de datos a lo largo del tiempo.
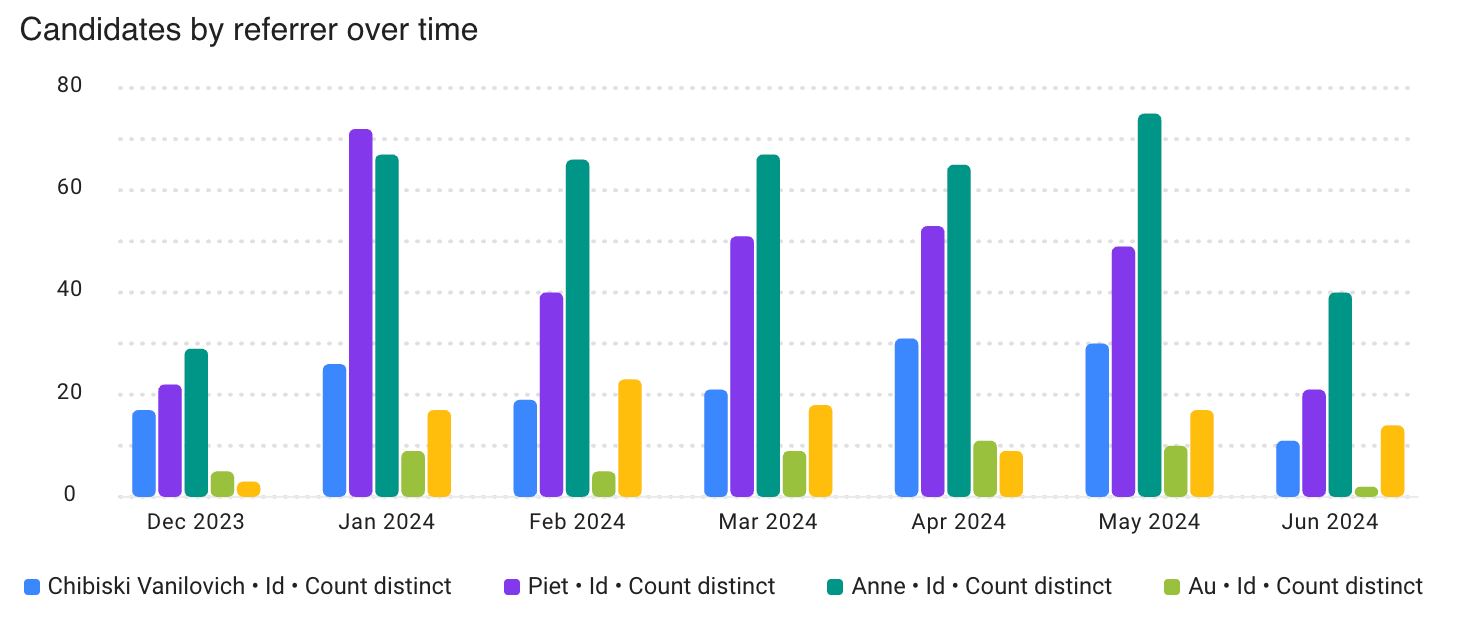
4. Candidatos por referente a lo largo del tiempo
-
Qué muestra: Los candidatos referidos creados a lo largo del tiempo, divididos por referente.
-
Utilice este informe para: Monitorear la actividad de referidos e identificar a los referentes recurrentes o de alto volumen.
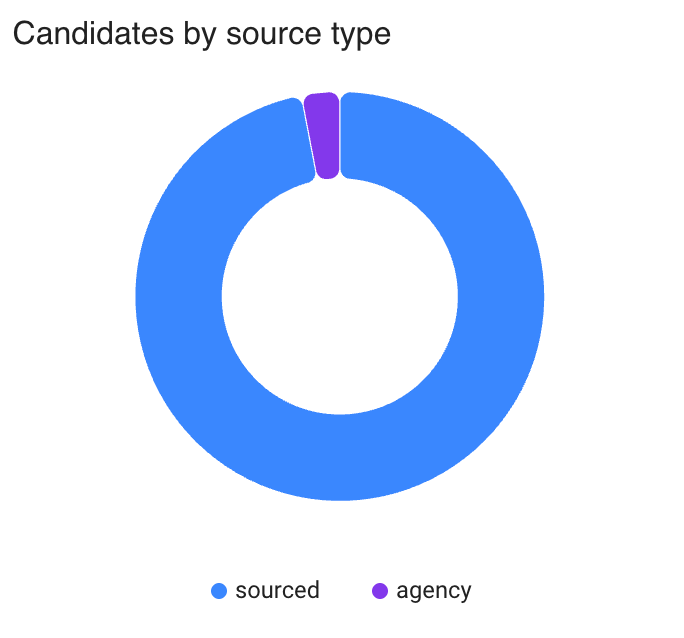
5. Candidatos por tipo de origen
-
Qué muestra: La proporción general de candidatos clasificados como contactados, postulados, referidos o de agencia.
-
Utilice este informe para: Comprender la composición de la base de datos de candidatos de un vistazo.
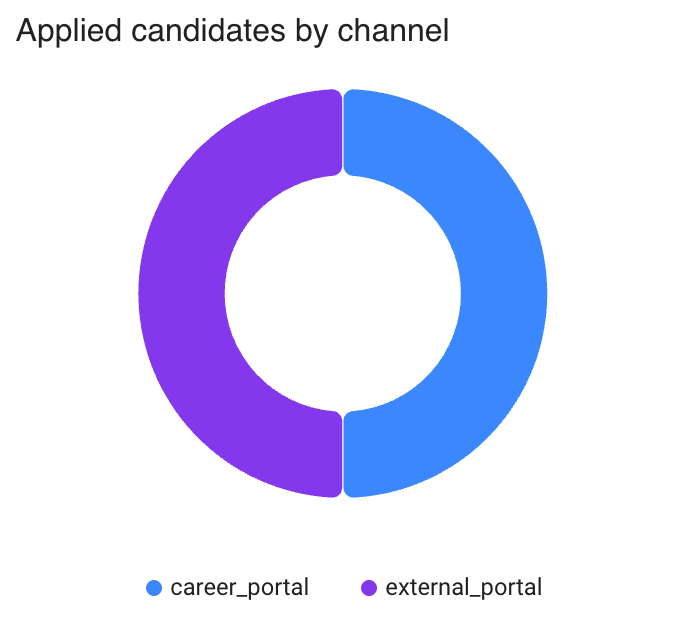
6. Candidatos postulados por canal
-
Qué muestra: La distribución de candidatos postulados por canal de adquisición, como portal de empleo, agencia, bolsa de trabajo gratuita o portal externo.
-
Utilice este informe para: Identificar qué canales de postulación generan la mayor cantidad de candidatos.
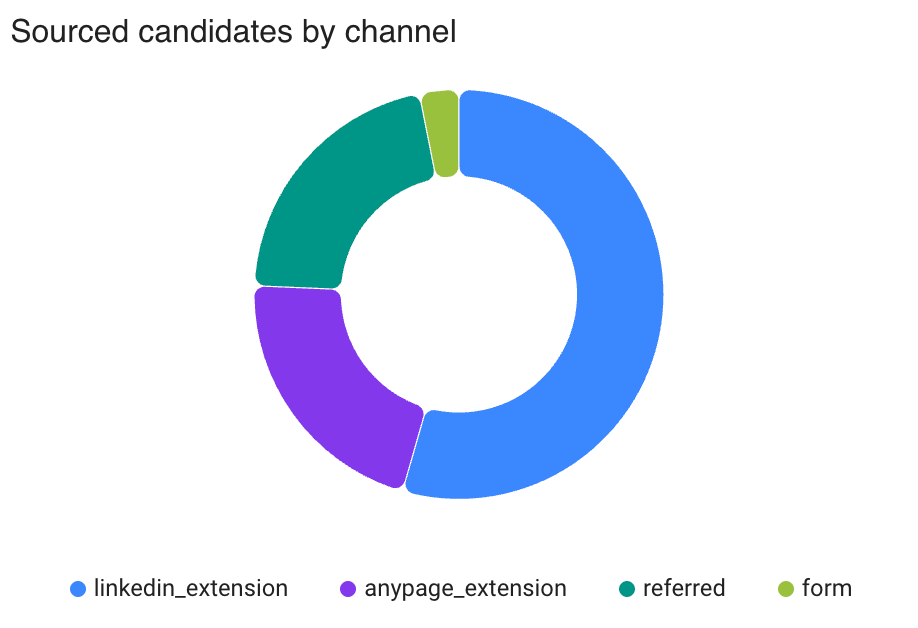
7. Candidatos contactados por canal
-
Qué muestra: La distribución de candidatos contactados por canal de búsqueda, como formulario, currículum, extensión, agencia o referencia.
-
Utilice este informe para: Comparar los métodos de búsqueda y ver por dónde ingresan los perfiles contactados a Manatal.
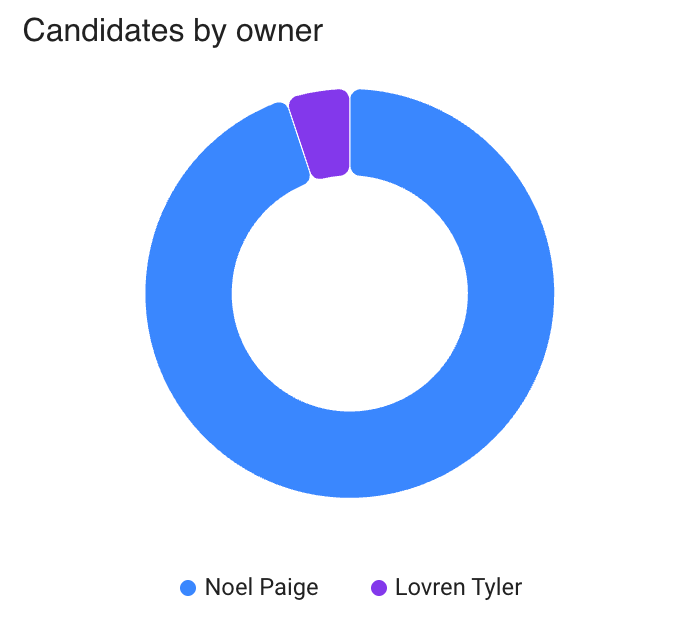
8. Candidatos por propietario
-
Qué muestra: La proporción de candidatos asignados a cada propietario.
-
Utilice este informe para: Comprobar la distribución de la propiedad.
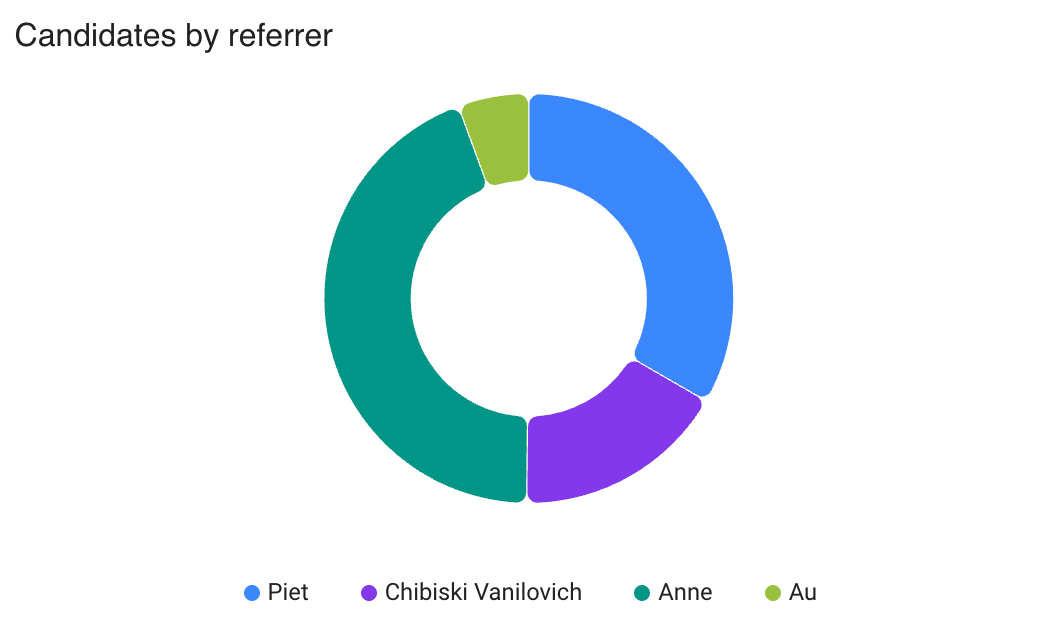
9. Candidatos por referente
-
Qué muestra: La proporción de candidatos referidos atribuida a cada referente.
-
Utilice este informe para: Identificar a los referentes que contribuyen con la mayor cantidad de candidatos.
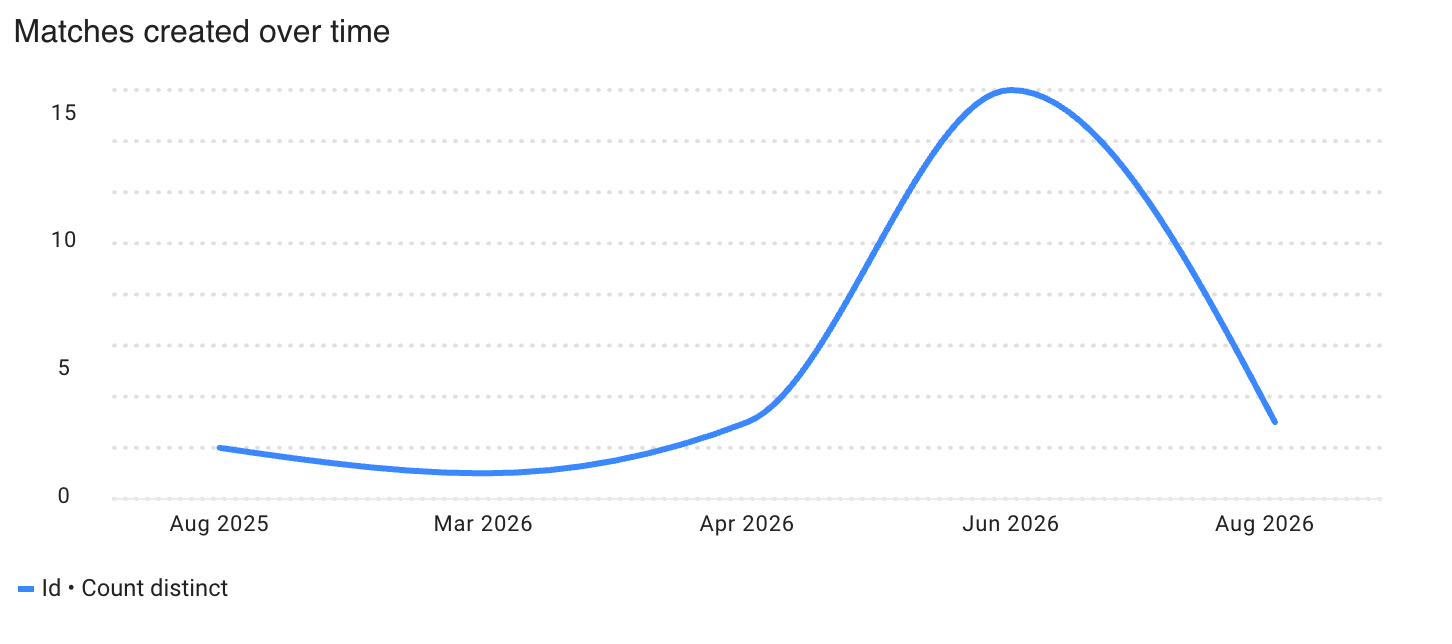
10. Coincidencias creadas a lo largo del tiempo
-
Qué muestra: El número de coincidencias de candidato con empleo creadas a lo largo del tiempo.
-
Utilice este informe para: Hacer un seguimiento de la actividad del flujo de reclutamiento y detectar períodos con un volumen de coincidencias inusualmente alto o bajo.
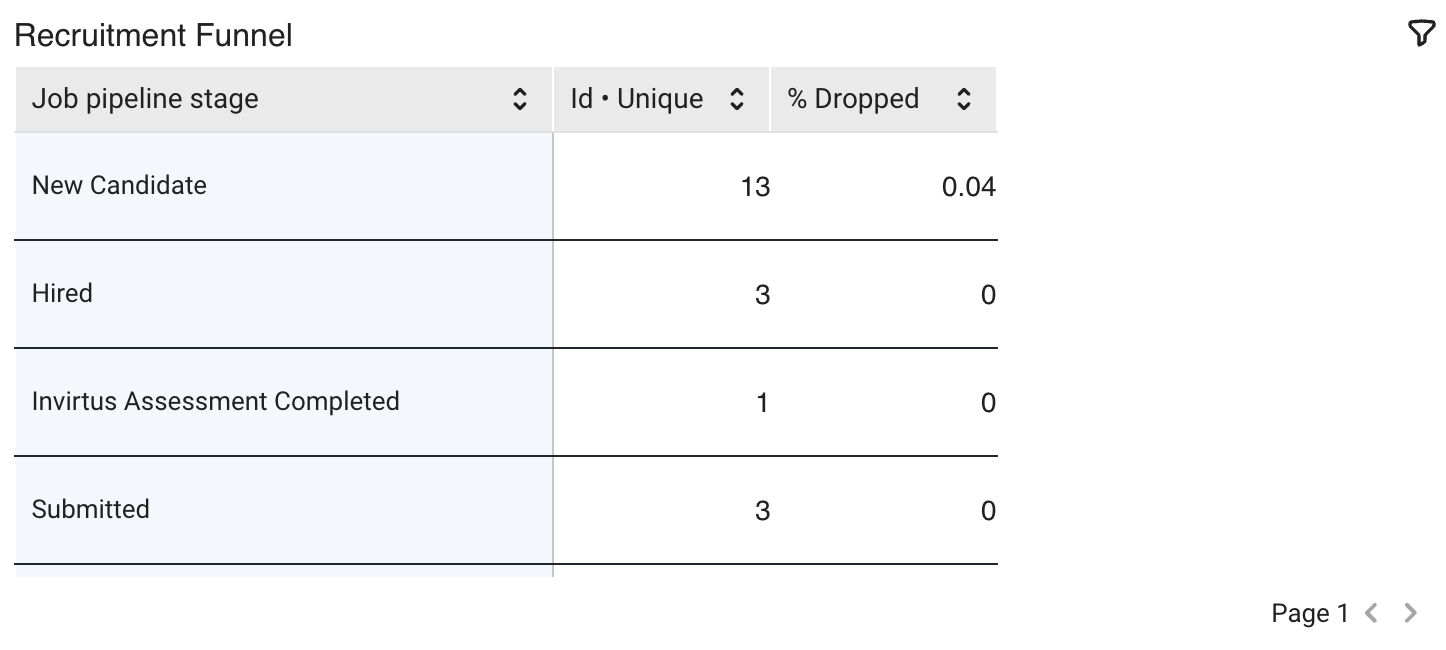
11. Embudo de Reclutamiento
-
Qué muestra: El volumen de coincidencias por etapa del flujo de trabajo, junto con el porcentaje de descartados en cada etapa.
-
Utilice este informe para: Encontrar etapas con alto volumen o alta tasa de abandono e identificar posibles cuellos de botella.
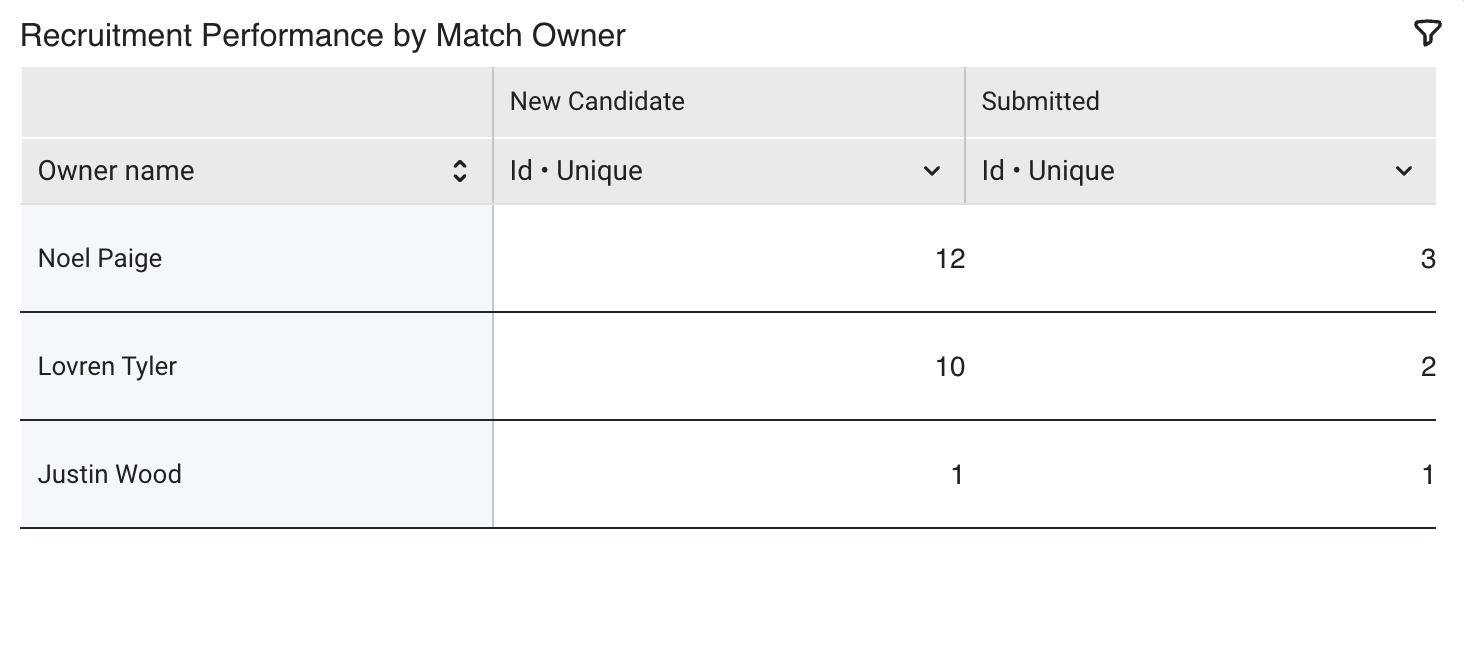
12. Rendimiento de Reclutamiento por Propietario de Coincidencia
-
Qué muestra: El número de coincidencias gestionadas por cada propietario, desglosadas por etapa del flujo de trabajo.
-
Utilice este informe para: Comparar la actividad de los reclutadores y comprender en qué parte del proceso se encuentran las coincidencias de cada propietario.
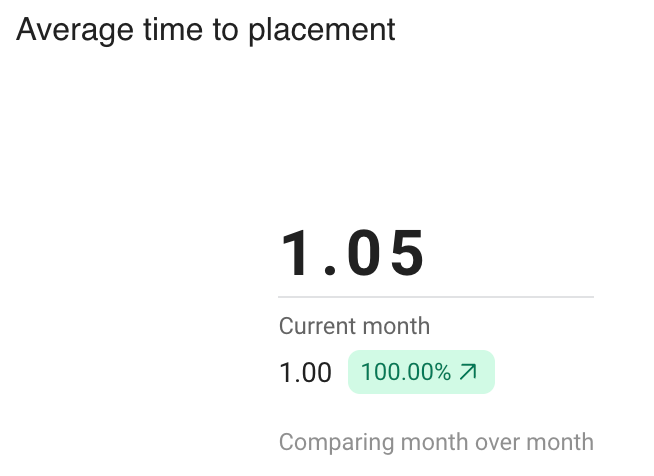
13. Tiempo promedio de colocación
-
Qué muestra: El tiempo promedio de colocación, con una comparación de tiempo cuando los datos de comparación están disponibles.
-
Utilice este informe para: Monitorear qué tan rápido las coincidencias exitosas alcanzan la colocación y si el promedio está mejorando.
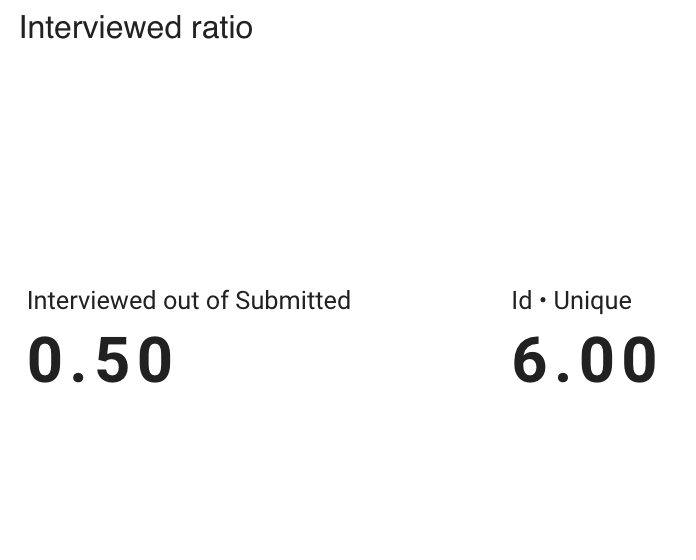
14. Proporción de entrevistados
-
Qué muestra: La proporción de coincidencias enviadas que alcanzaron una etapa de entrevista, junto con el número de coincidencias únicas.
-
Utilice este informe para: Medir la frecuencia con la que los envíos al cliente avanzan hacia las entrevistas.
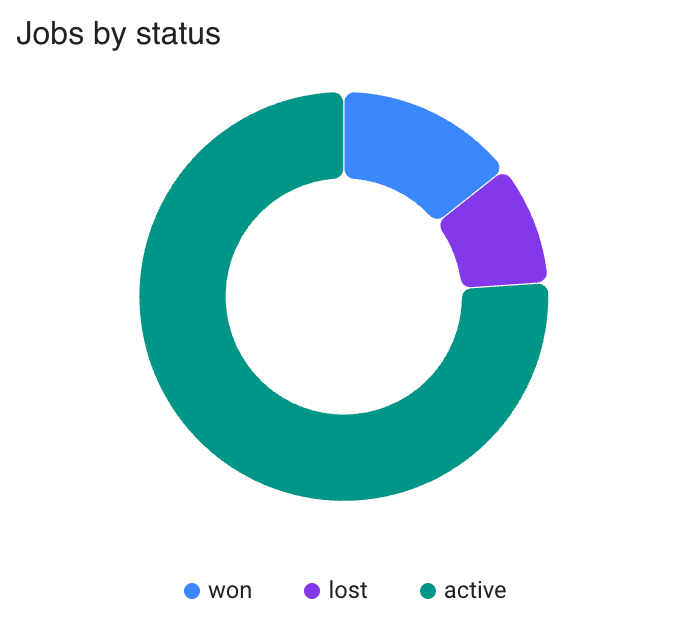
15. Empleos por estado
-
Qué muestra: La proporción de empleos por estado, como activo, ganado, perdido, en planificación o en pausa.
-
Utilice este informe para: Comprender el portafolio actual de empleos y ver si la mayoría de los empleos están activos o cerrados.
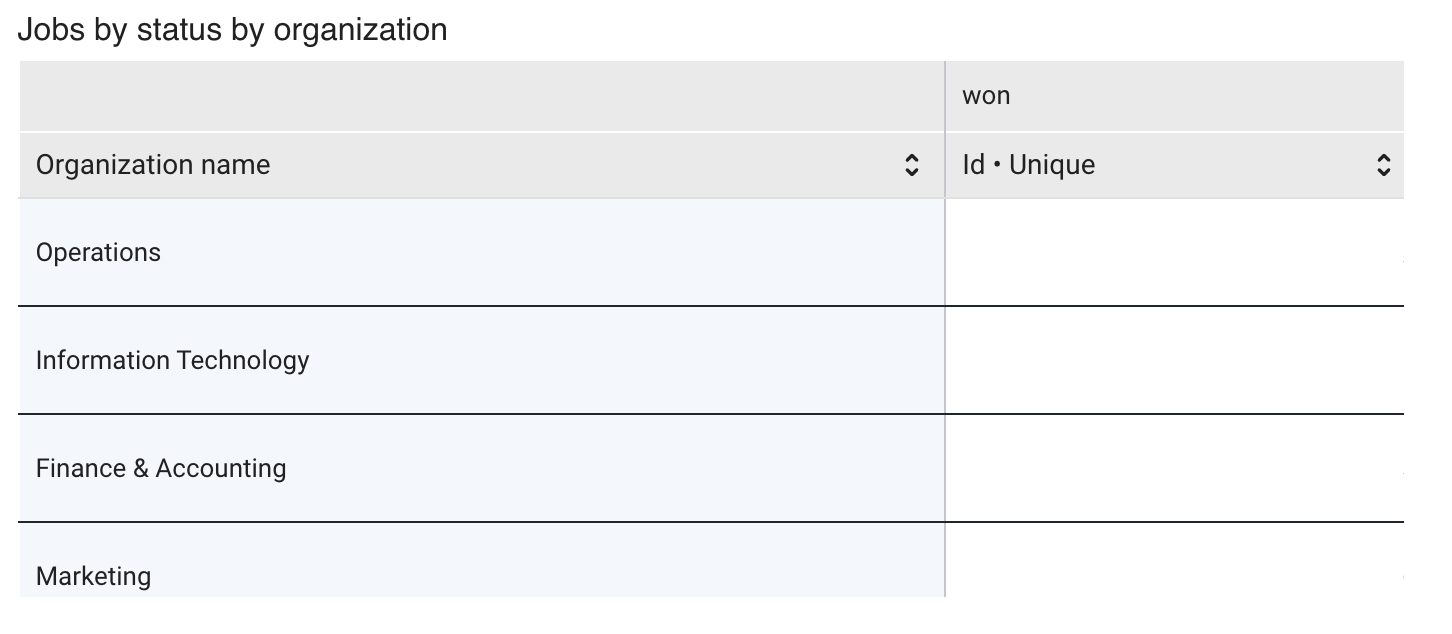
16. Empleos por estado por organización
-
Qué muestra: Los conteos de empleos para cada organización, desglosados por estado del empleo.
-
Utilice este informe para: Revisar qué clientes tienen empleos activos, ganados, perdidos, planificados o en pausa.
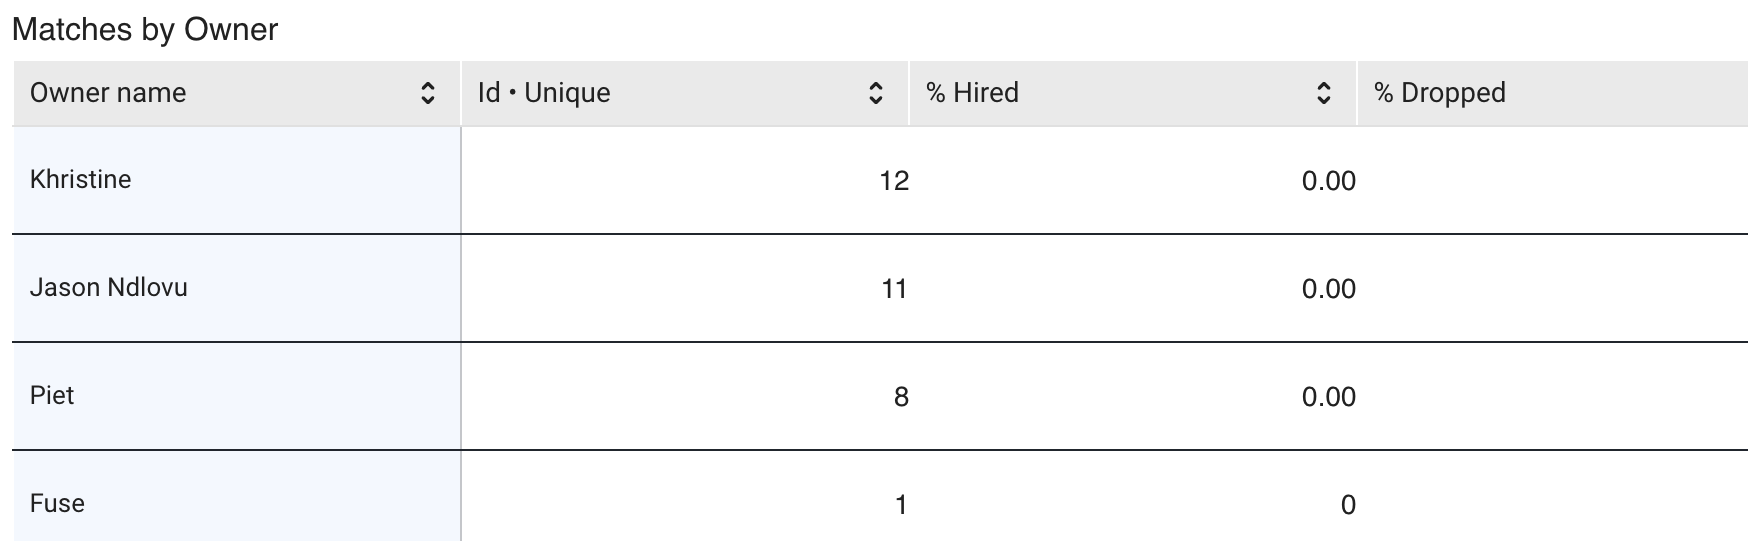
17. Coincidencias por Propietario
-
Qué muestra: El conteo de coincidencias únicas y las proporciones de resultados de cada propietario, incluyendo el porcentaje de contratados y el porcentaje de descartados.
-
Utilice este informe para: Comparar el volumen de coincidencias y los resultados entre reclutadores o propietarios de coincidencias.
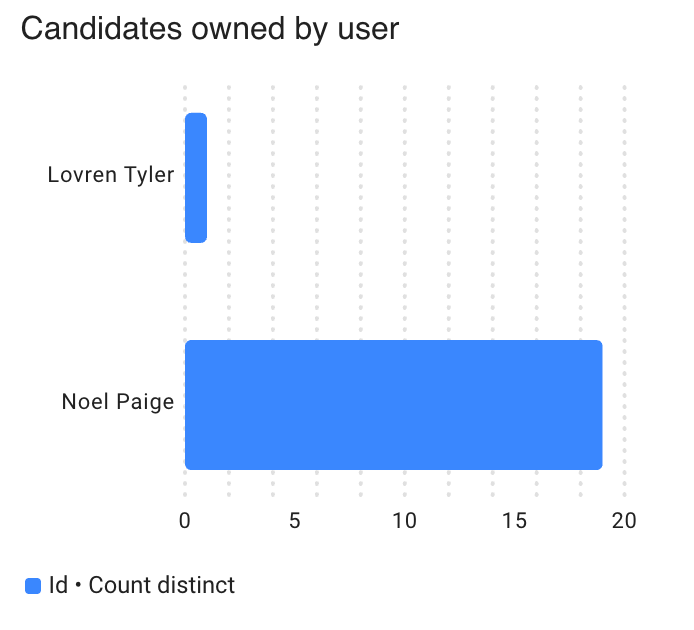
18. Candidatos propiedad del usuario
-
Qué muestra: El número de registros de candidatos propiedad de cada usuario en un gráfico de barras horizontales.
-
Utilice este informe para: Comparar la propiedad de candidatos entre usuarios.
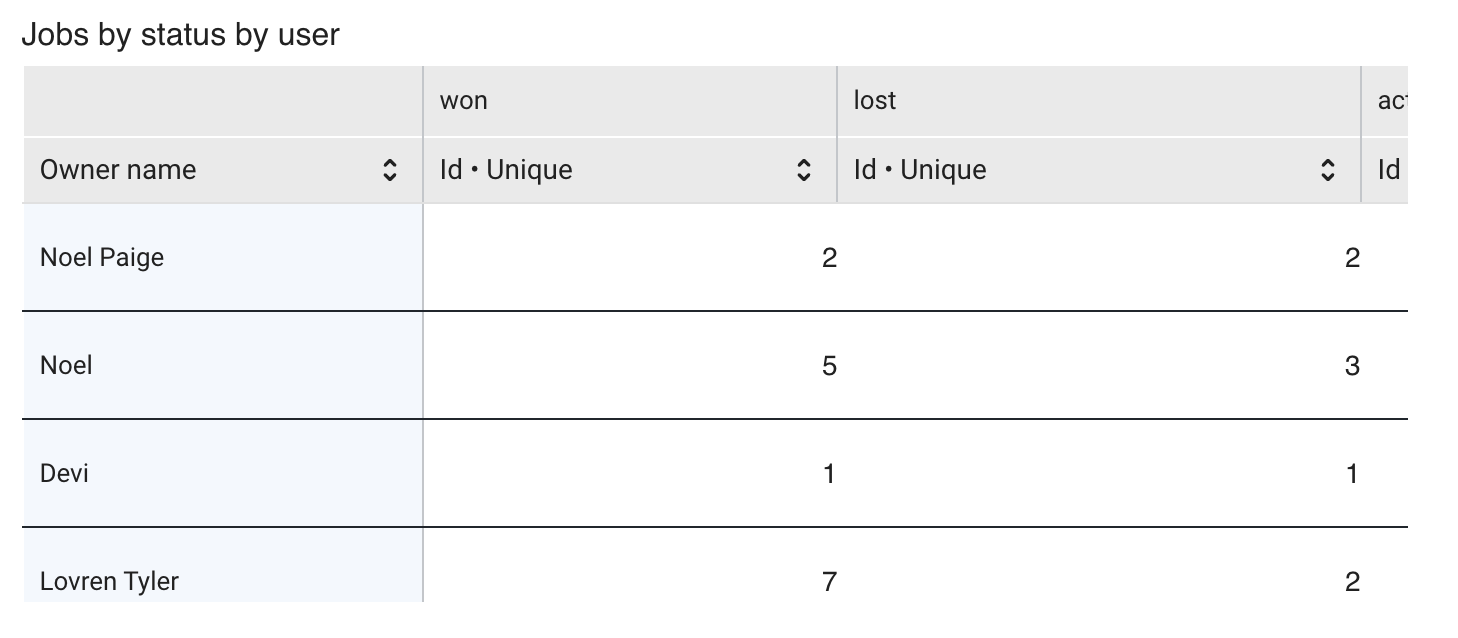
19. Empleos por estado por usuario
-
Qué muestra: Los conteos de empleos para cada propietario, desglosados por estado.
-
Utilice este informe para: Ver el portafolio de empleos activos y cerrados de cada usuario y revisar la asignación en todo el equipo.
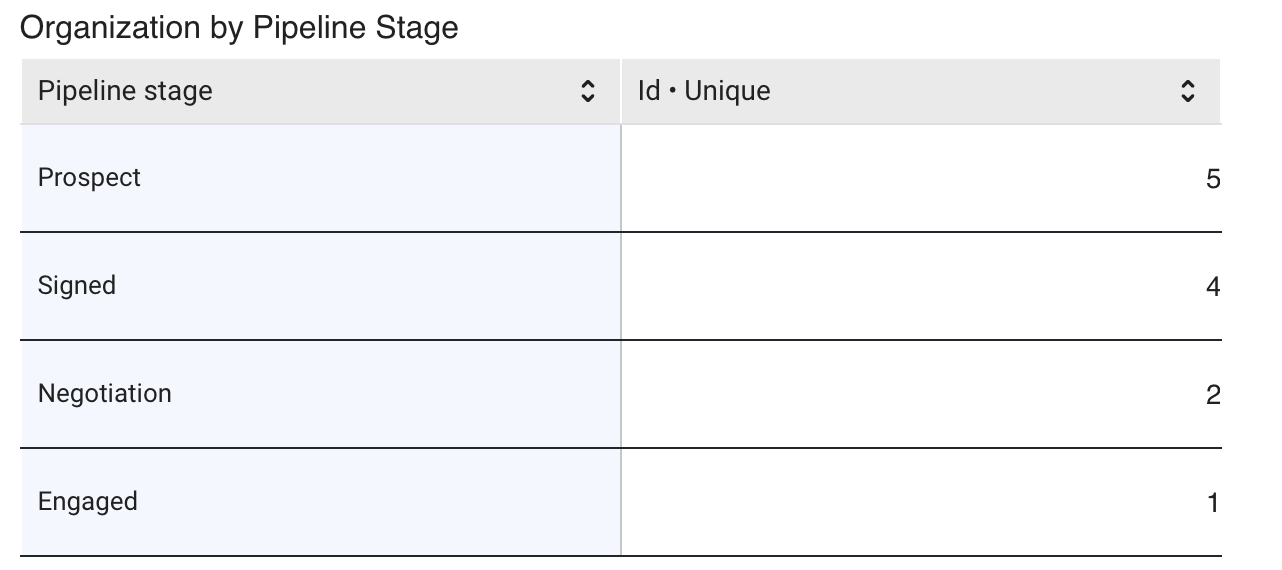
20. Organización por Etapa de Flujo de Trabajo
-
Qué muestra: El número de organizaciones en cada etapa del flujo de trabajo de la organización.
-
Utilice este informe para: Revisar el flujo de desarrollo de clientes y ver dónde se concentran las organizaciones.
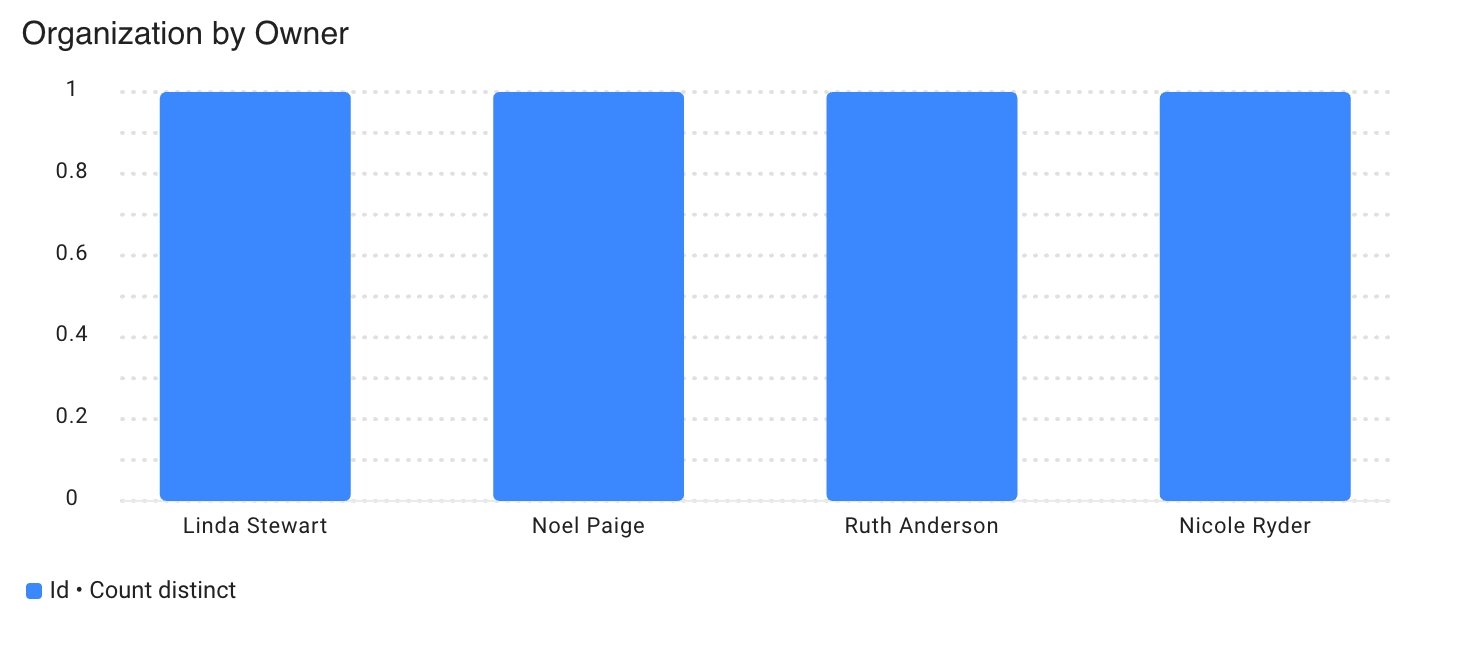
21. Organización por Propietario
-
Qué muestra: El número de organizaciones propiedad de cada usuario.
-
Utilice este informe para: Comparar la propiedad de las cuentas de clientes.
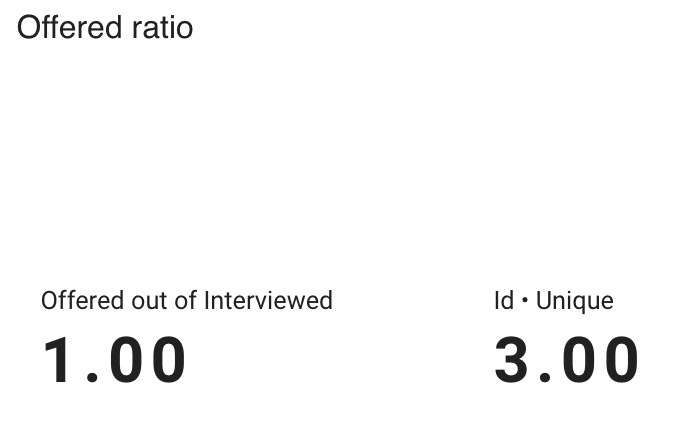
22. Proporción de ofertas
-
Qué muestra: La proporción de coincidencias entrevistadas que alcanzaron la etapa de Oferta, junto con el número de coincidencias únicas.
-
Utilice este informe para: Medir la conversión de entrevista a oferta.
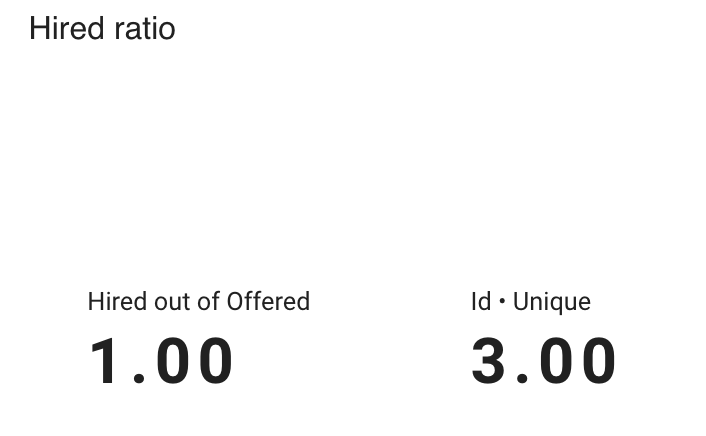
23. Proporción de contratados
-
Qué muestra: La proporción de coincidencias con oferta que alcanzaron la etapa de Contratado, junto con el número de coincidencias únicas.
-
Utilice este informe para: Medir la conversión de oferta a contratación.